Using Geometric Layouts
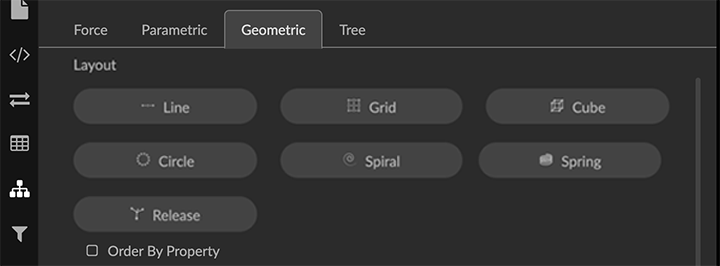
Geometric layouts let you display all nodes or selected nodes in a Line, Grid, Circle, Spiral, or Cube, ordered by one of the property values in the data. The edges between nodes continue to be displayed, so that connections in the graph data can still be seen.
The nodes in a geometric layout are pinned. The Release button returns all visible nodes to the default force-directed layout.
In addition, you can:
Distribute selected nodes in an X, Y, or Z direction ordered by a property value. This is useful for grouping data by date and time or other numerical or categorical property values.
Align nodes along the virtual X, Y, and Z axes of the project space.
Rotate, Scale, and Shift nodes in the project space by specified amounts. This provides fine control of layouts that help you craft compelling visualizations.
Create hierarchical Ring or Tree layouts of specified depth around selected nodes.
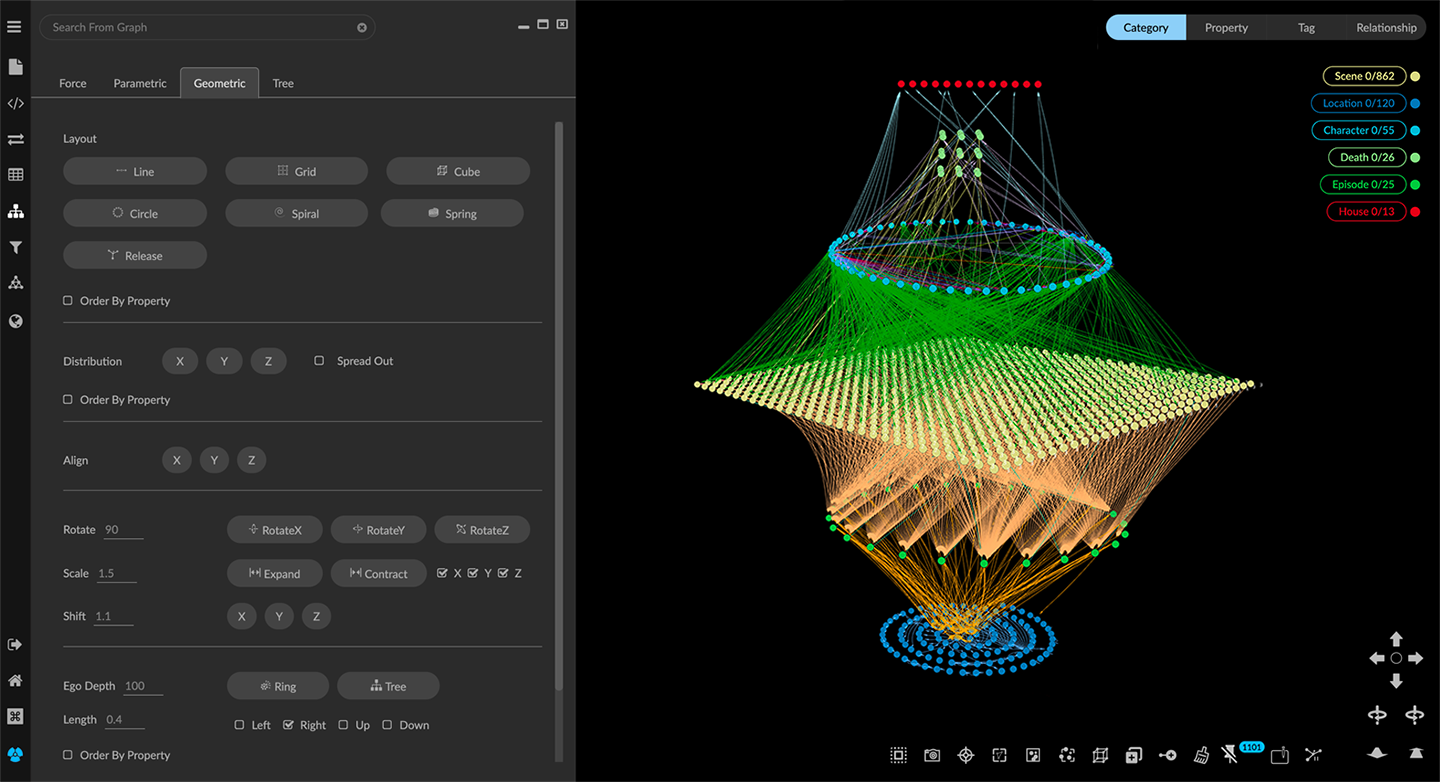
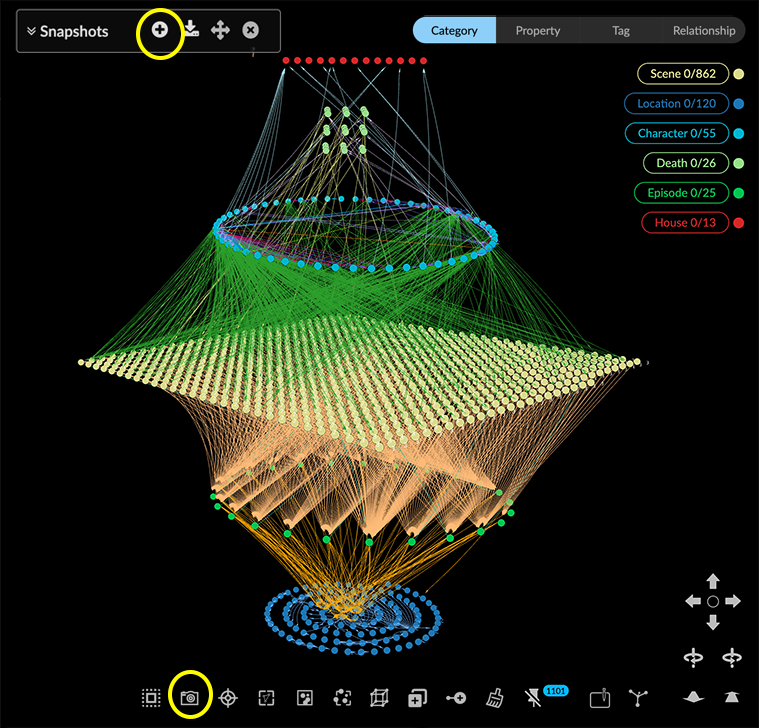
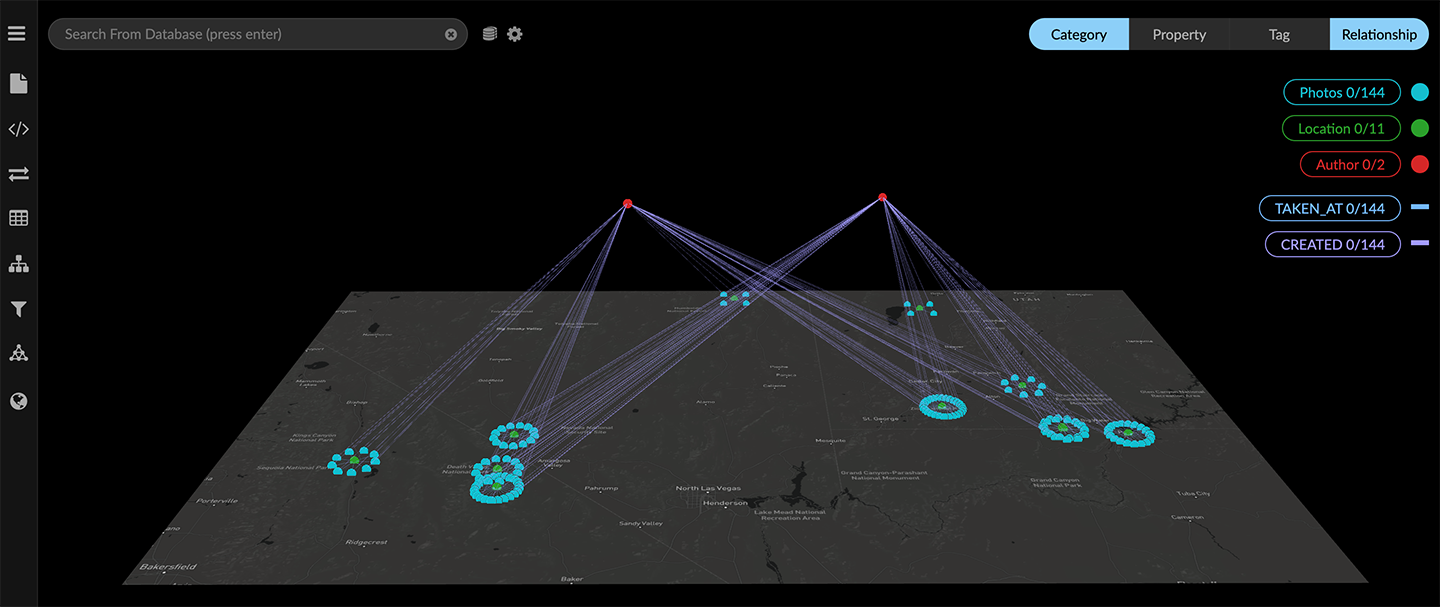
You can combine layouts in a variety of ways. For example, the layout above uses a Grid layout for one of the categories of nodes (Location), and then applies a Ring layout to the nodes of a different category (Photos) which are connected by one edge to the nodes in the grid.
Layouts can’t be reverted easily, so make a habit of saving Snapshots as you work.
You can save any layout as a Snapshot or data View.
Applying a geometric layout
You can apply one of five automatic geometric layouts, either to all the data or a selection. In the example layout above, nodes for each category are displayed in a different geometry.
To apply a geometric layout:
Open the Layout panel’s Geometric tab.
Select nodes to lay out using any method. Often, you’ll want to select all the nodes of a given category or tag using the legend. If no nodes are selected, the layout will be applied to all the data.
Now click the Line, Grid, Circle, Spiral, or Cube button to display the data in that layout.
With the layout selected, you can move the nodes as a group, and you can further adjust the orientation, size, and position using Rotate, Scale, and Shift layout controls.
Whether or not any data are selected, the Release layout button returns the entire graph to a force layout and releases any pinned nodes. This action cannot be undone. To avoid losing useful layouts by mistake save Snapshots of your data (and download your snapshot archive regularly).
Ordering the nodes in a geometric layout by a property value
One of the property values available in a data selection can be used to order the nodes in a geometric layout.
To order a geometric layout by a property value:
Select nodes to be ordered, for example, using the legend to select all nodes of a given category.
In the Layout section, click the Order by property checkbox to display its Category and Property dropdown menus.
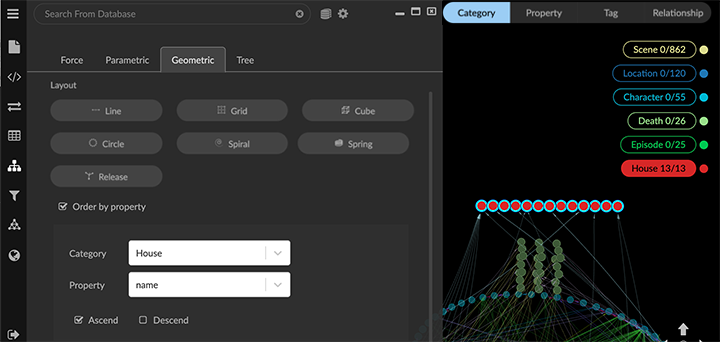
Select the category and property name you want.
Click the Ascend or Descend checkbox to display the nodes in either ascending or descending order.
Click the geometric layout you want (i.e. Line, Circle, Spiral, Grid, or Cube.)
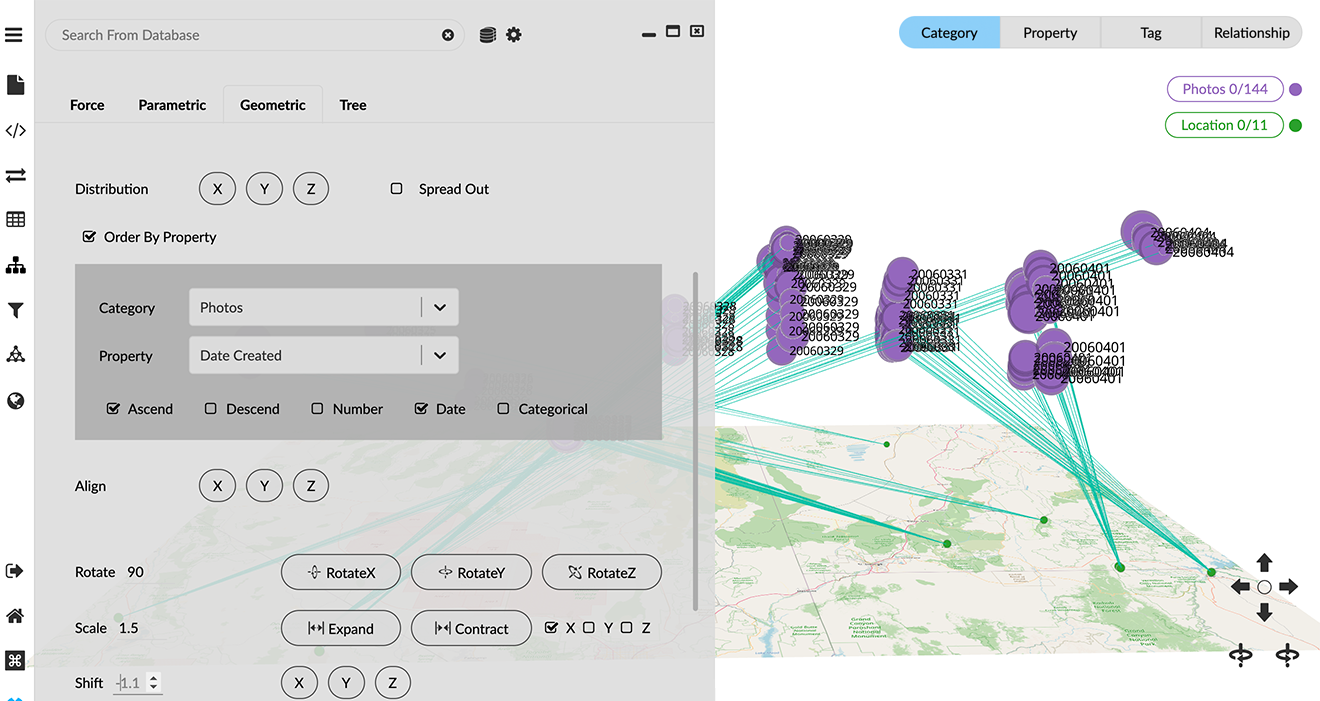
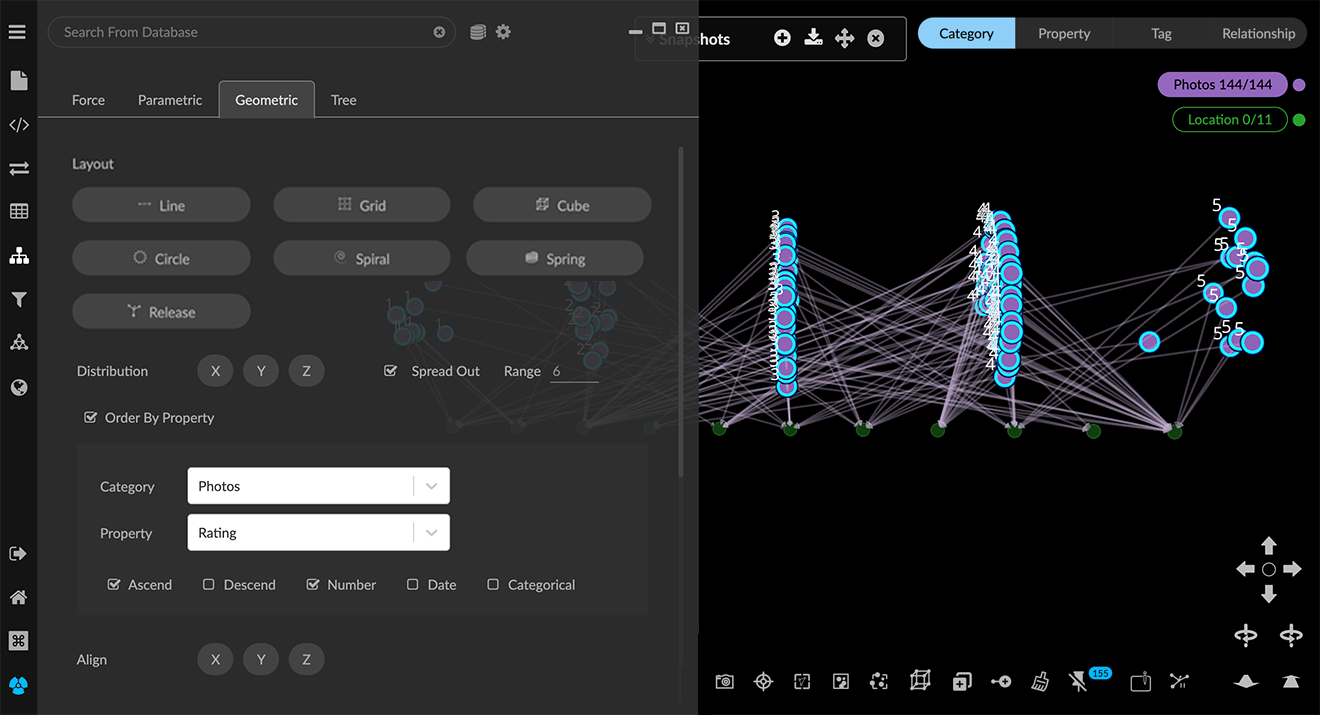
Distributing nodes by a property value
The Distribution option lets you use one of the property values available in a selection to group the nodes and distribute those groups in the project space in X, Y, or Z directions. With Distribution, you can group data quickly by date or by another numerical or categorical property available in your data. This helps you highlight patterns quickly and makes it easier to select groups of nodes for further inspection, labeling, and analysis.
To distribute nodes by a property value:
Select nodes to to be grouped and distributed, for example, using the legend to select all nodes of a given category.
Click the Spread Out checkbox to enter a scale Range by which the groups of nodes will be distributed in the graph space.
Click the Distribution option’s Order by property checkbox to display Category and Property dropdown menus.
Select the category and property you want.
Click the Ascend or Descend checkbox to display the distributed groups in either ascending or descending order.
Click either Number, Date, or Categorical checkboxes, depending on the value of the property you selected.
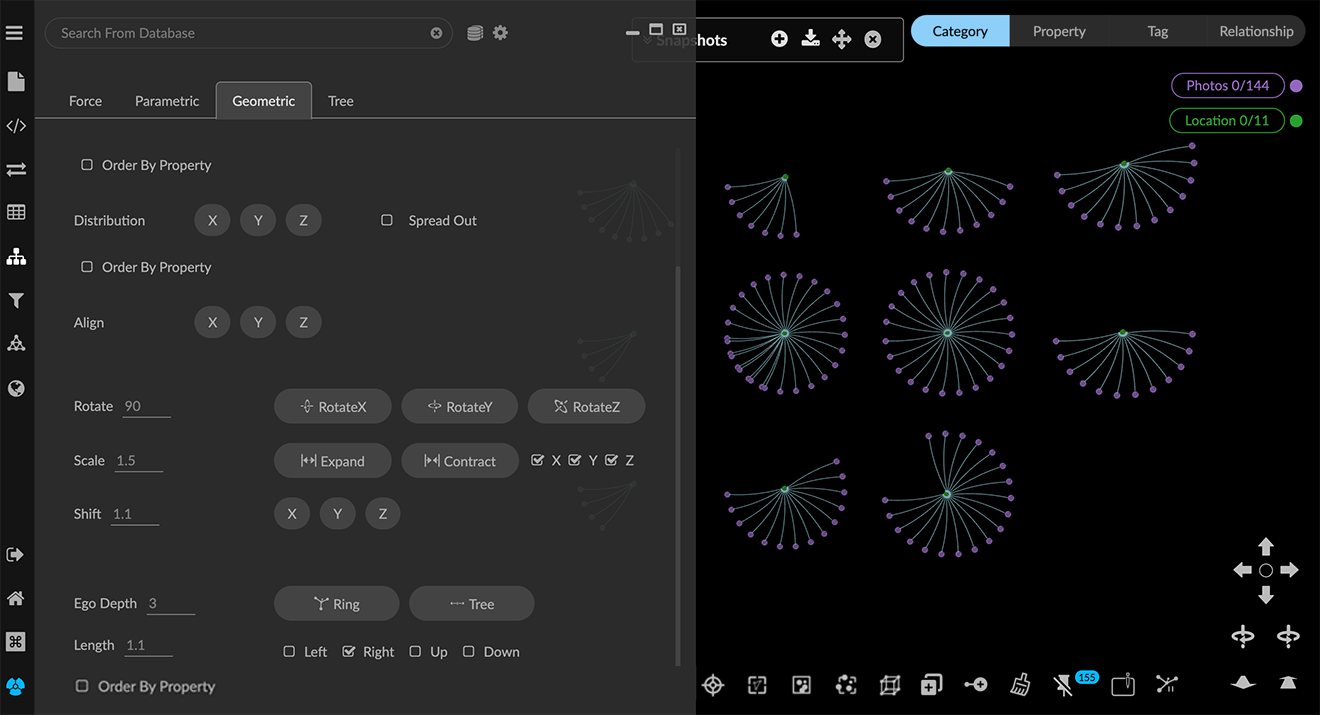
Now click the X, Y, or Z button to group and distribute the selected data. In the example, we’ve chosen to group Photos nodes by their Ratings property values (1 to 5), and distribute the groups on an X axis.
When the selected data is grouped and distributed, it is also pinned in the graph space. If the distribution isn’t quite what you want, simply press the Release icon (or right-click and select Actions>Release, or use Ctrl+P) to start over.
You can further adjust distributed groups using Rotate, Scale, and Shift layout controls.
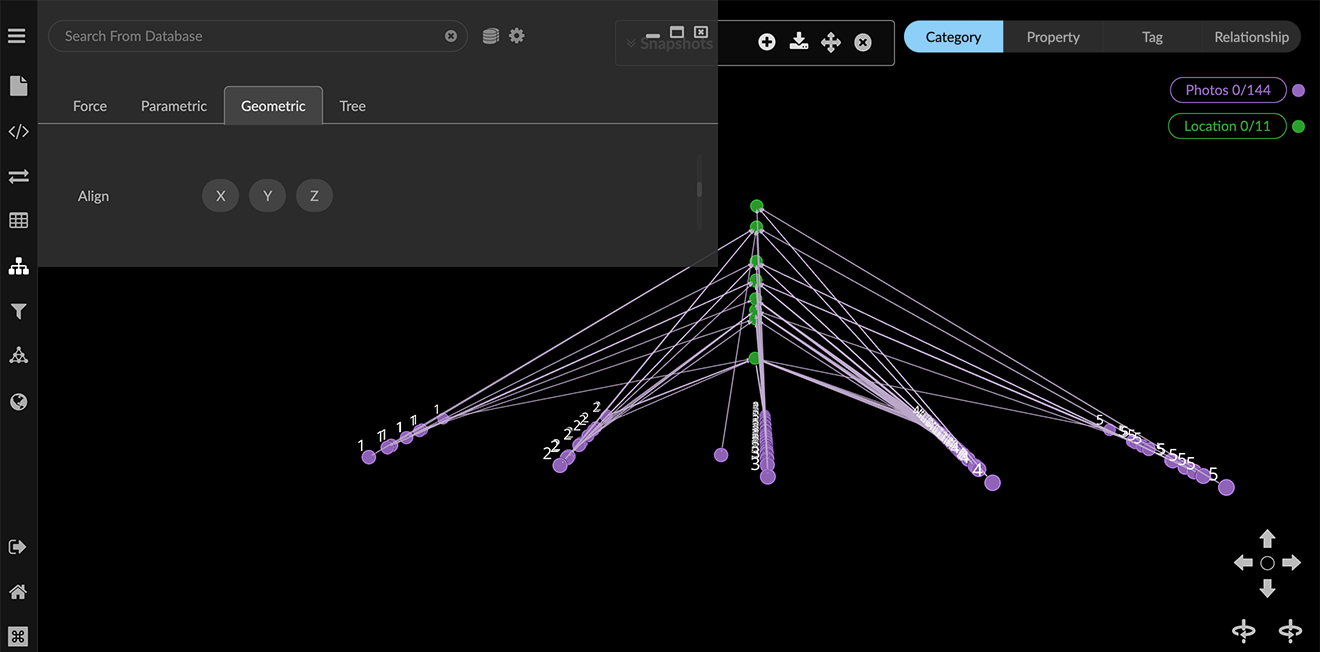
Aligning nodes
The Align option projects the selected (or all) nodes onto the remaining axes. This is useful for organizing and separating data into various kinds of groupings.
For example, click X to project nodes to the Y and Z axes. If you click two of the buttons, for example, X and Z, the nodes are projected onto the Y axis, in a line.
If you click all three buttons, the nodes are stacked on top of one another at the origin viewpoint. While they are still selected, you can click one of the Layout options to unstack them.
In the example below Location nodes, and distributed Photo nodes grouped by Rating were all projected onto an X axis (and the Location nodes moved up using Ctrl+5-drag or spacebar+drag).
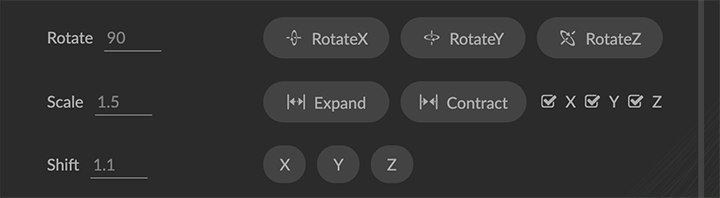
Using the Rotate, Scale, and Shift layout controls
You can move the nodes in a layout as a group, and you can further adjust the orientation, size, and position using Rotate, Scale, and Shift layout controls. You can select any group of nodes. If no data are selected, the controls operate on all the data.
You can:
Rotate separately along the X, Y, or Zaxes, for fine-tuned control of 3D orientation. Enter a number of degrees to rotate the layout (either a positive or negative value), then click Rotate X, Rotate Y, or Rotate Z buttons.
Scale a selection (or the entire layout). You can either expand or contract the scale, and choose to scale along X, Y, and/or Z axes as well. Enter a Scale factor, select axes using the checkboxes, then click Expand or Contract. For example, you can expand the scale for data displayed in a line, and contract the scale for other data displayed in circles or grids.
Shift data on the X, Y, or Z axis to separate selected data visually in the graph space. Enter a Shift factor (either a positive or negative value) and click X, Y, or Z.
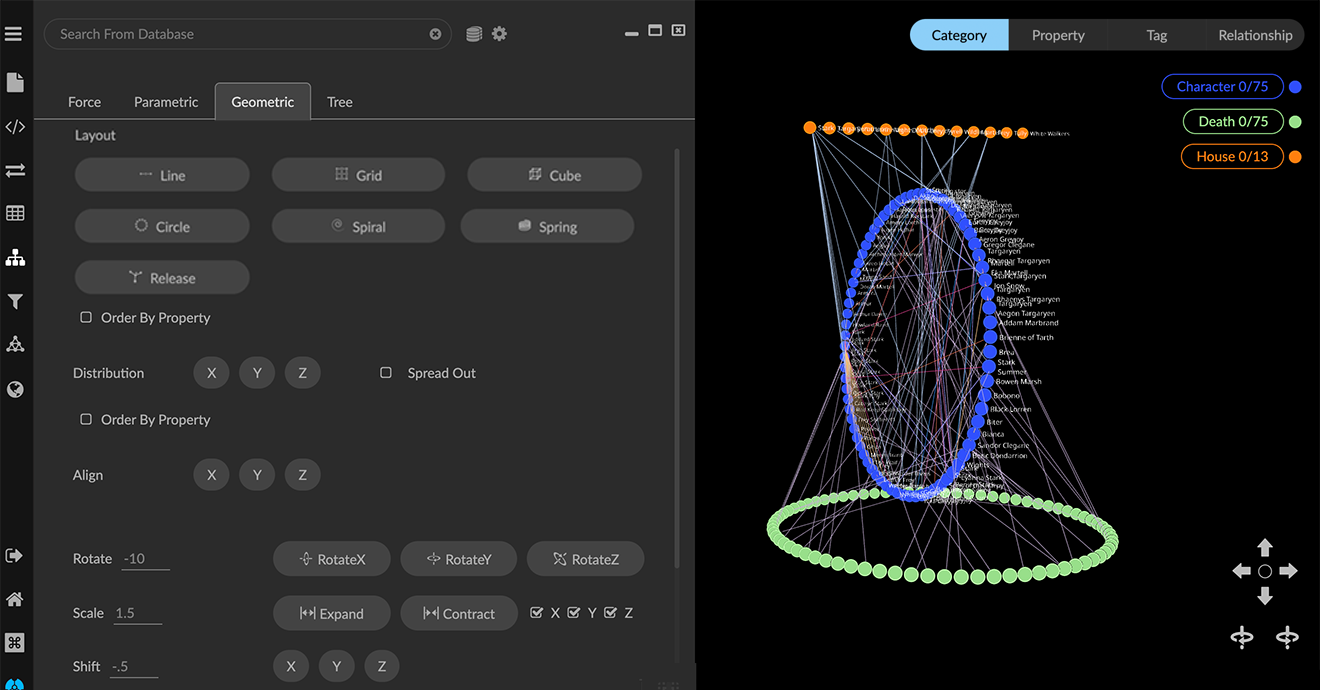
Using Ring or Tree hierarchical layouts
The Ring or Tree hierarchical layouts let you select a node (or nodes) as central points and arrange neighboring nodes according to the number of edges away they are from the centers.
Ring or tree hierarchies can greatly aid visualization when combined with another geometric layout, such as the following Grid layout:
They are also useful for geospatial display since the rings or trees persist when central data nodes with lat-long coordinates are dropped onto the map.
You can:
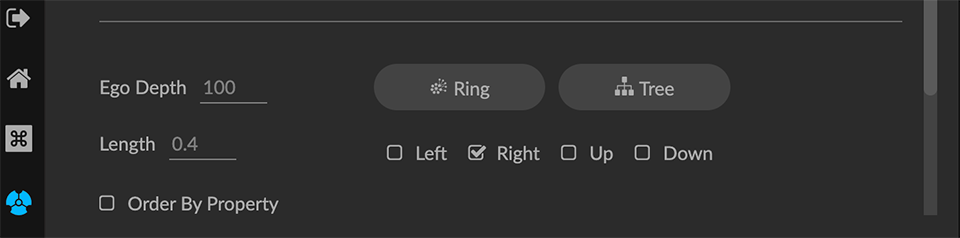
Set the Ego Depth of the hierarchy (i.e. the number hops from the selected central nodes to include). The default depth of 100 will typically include all the data since a depth of 100 connections will cover most graphs. For example, with an Ego depth of 3, nodes NOT selected as centers AND three edges away are included. Nodes further away remain in the original force layout.
Set the relative Length of the connecting edges. The default length of 0.4 is suitable for many graphs.
Order the data in rings or trees by a property value.
Orient rings or trees using Left, Right, Up or Down checkboxes.
To display a hierarchical ring or tree layout:
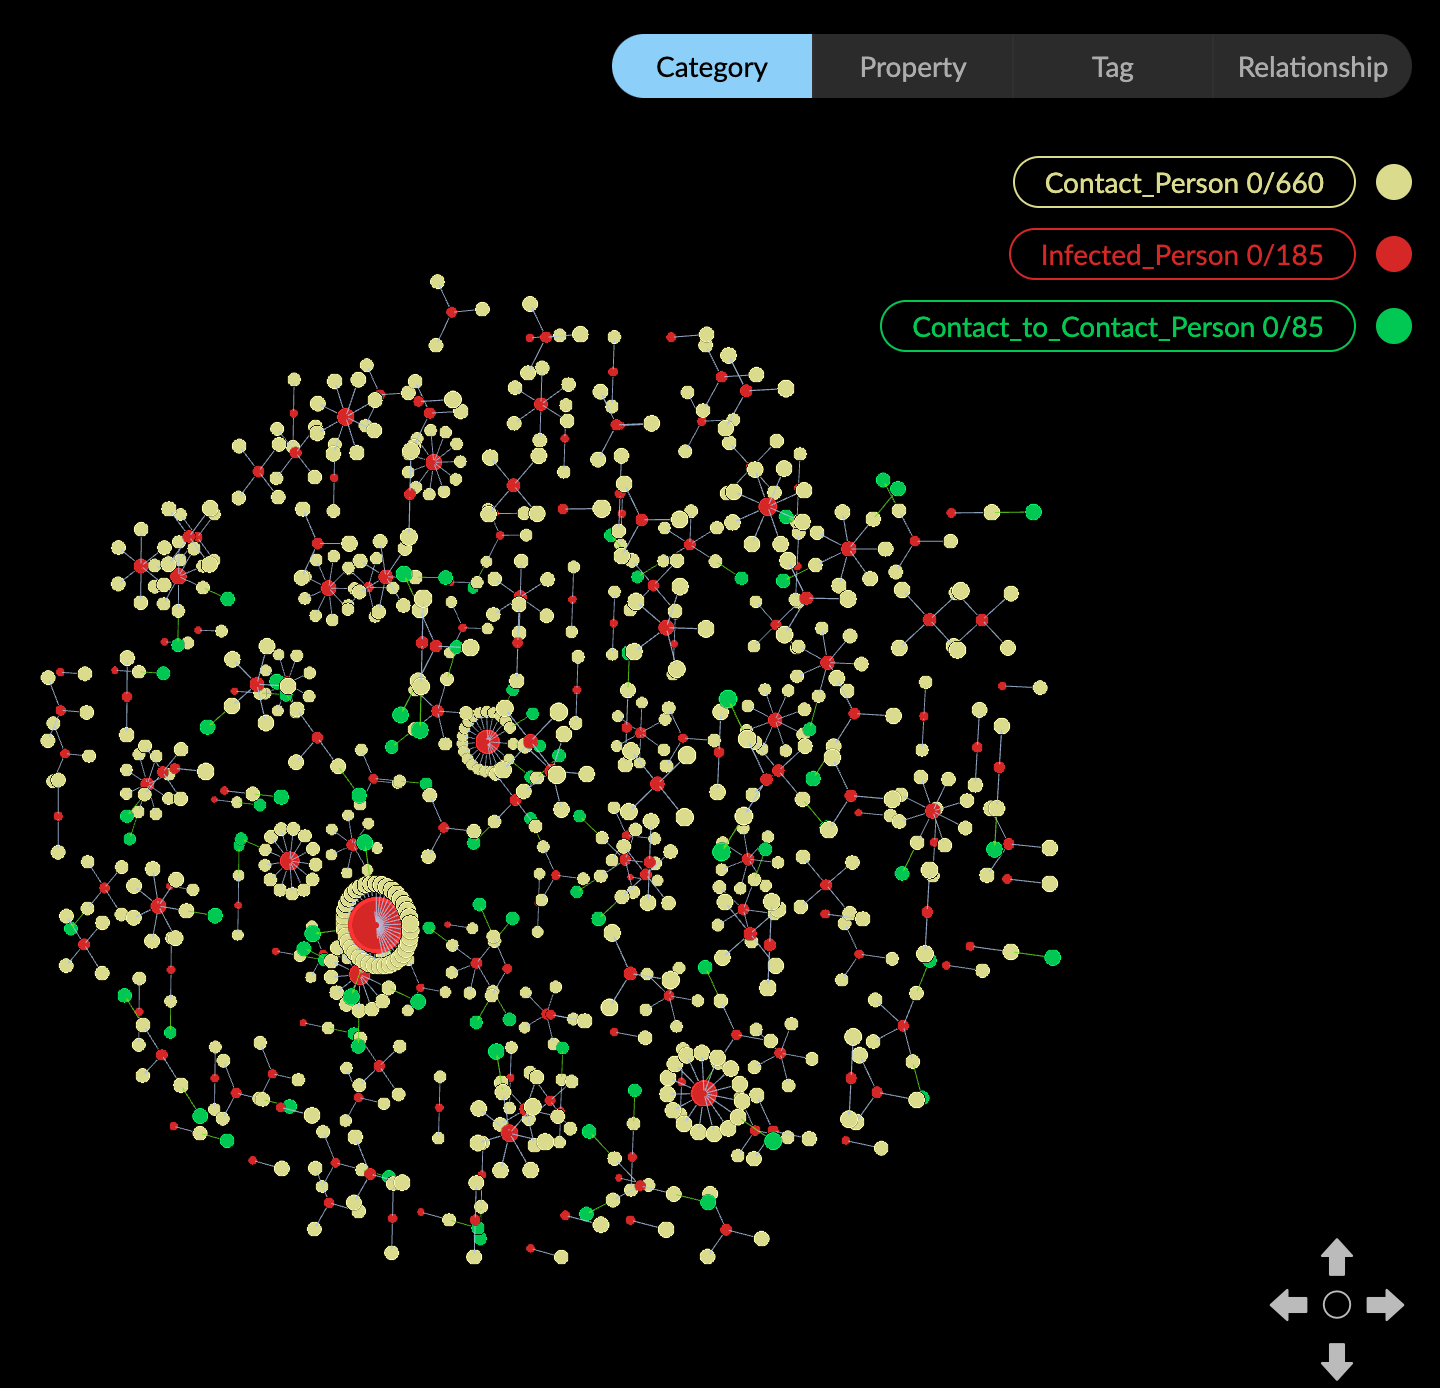
Select nodes of primary interest as your center nodes. In this example from a contact tracing dataset, we select all Infected_Person nodes, laid out in a grid ordered by the number of connections for each node.
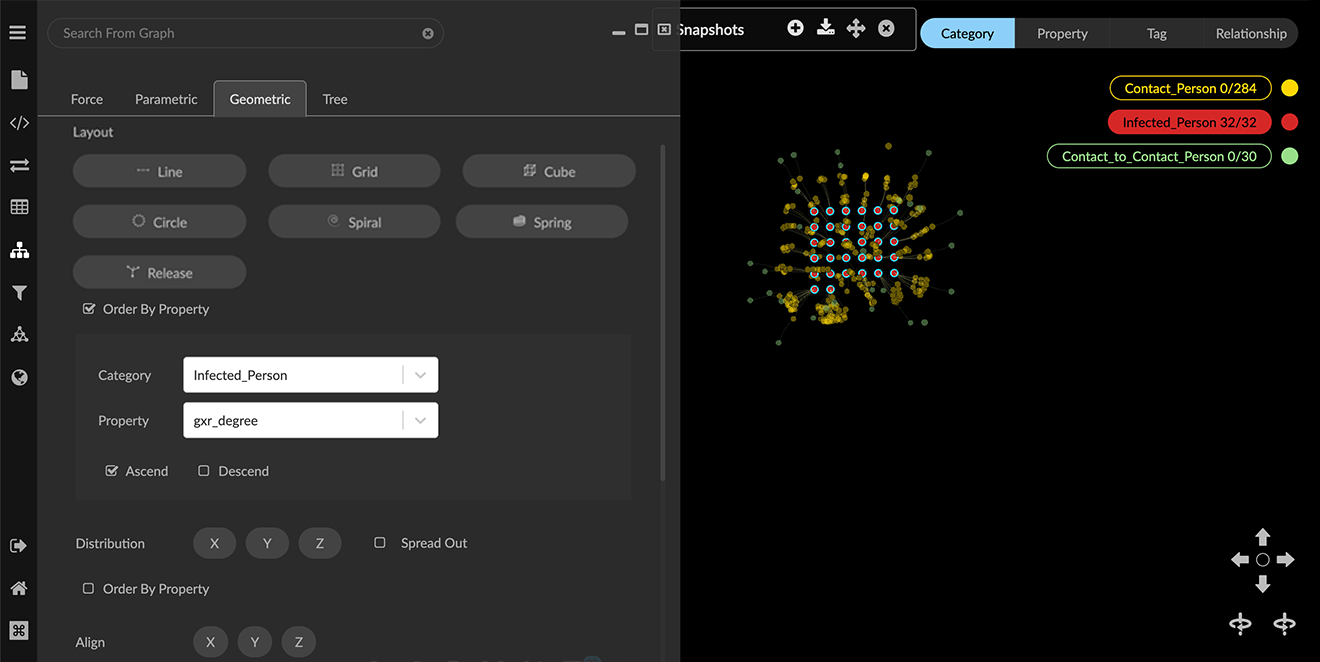
Now scroll down to the Scale option and click the Expand button several times to expand the grid layout. This makes room to arrange first- and second- level contacts in rings or trees around the central nodes.
With the central Infected_Person nodes still selected, click the Ring button.
With the default Ego depth of 100, nodes NOT selected as centers AND 100 edges away are displayed in concentric rings around the central nodes.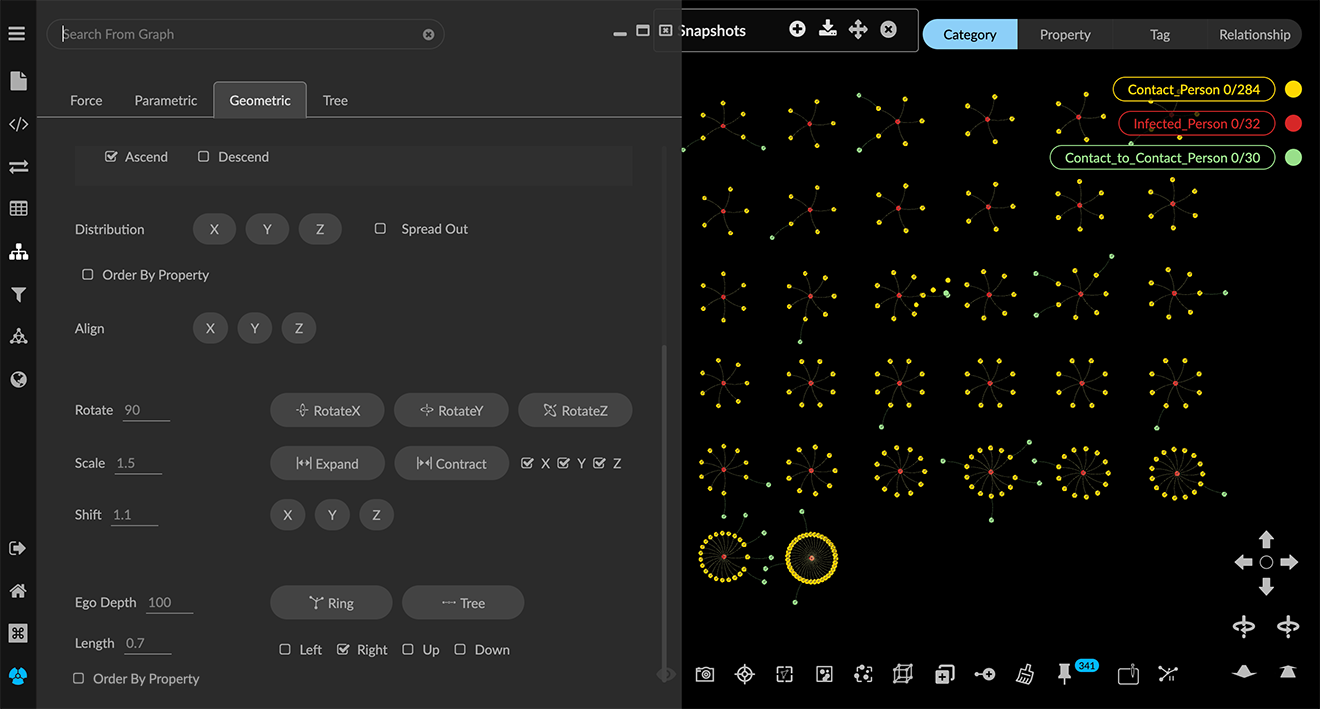
You can adjust the display further using Left, Right, Up, or Down checkboxes. Click one of the checkboxes, then click Rings to rotate or reflect the connected rings
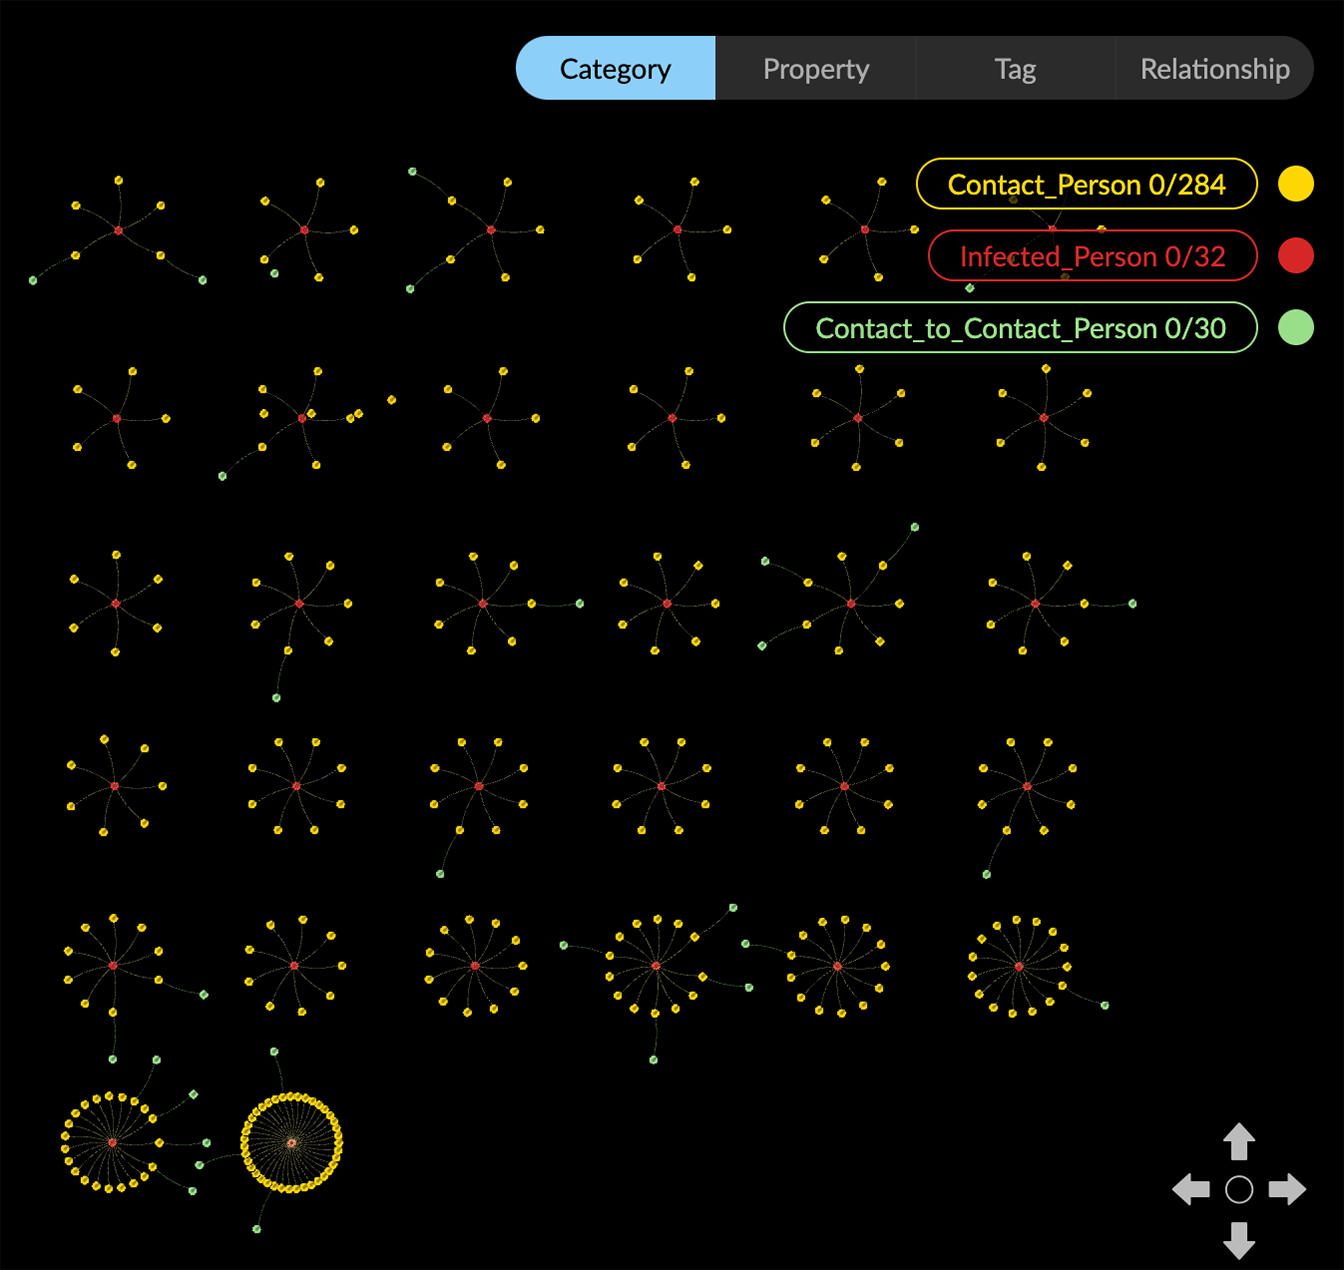
Now with Infected_Person nodes still selected, click Trees to see a tree layout for nodes the default 100 edges away from the selected nodes.
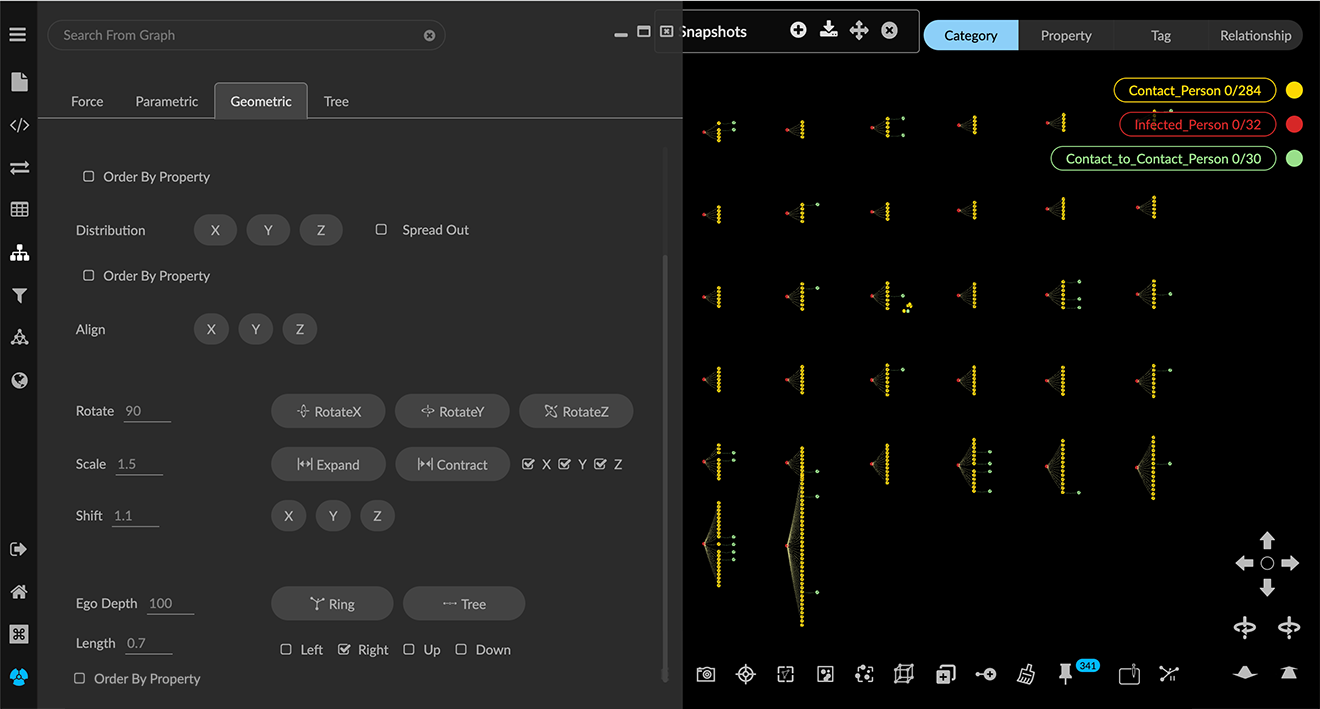
You can adjust the layout further using Left, Right, Up, or Down checkboxes.
Click one of the checkboxes (for example, Right), then with your central nodes selected, click Trees to see the layout to the left of the central nodes.Now click the Up checkbox and click Trees again. The tree layouts now appear above the central nodes, rather than to the left of them.
To share a static image of a layout, you can click the Take Screenshot icon in the toolbar. It downloads a .png screenshot of the project space that includes just the data and the legend (not the toolbar, panel menu, panel or any other UI elements).
Creating a Quick Layout from the context toolbar or menu
The Quick Layout toolbar icon or Layout in the right-click menu provides simplified options for quickly applying and modifying pre-set geometric layouts to all or part of your data.
You can use the menu to:
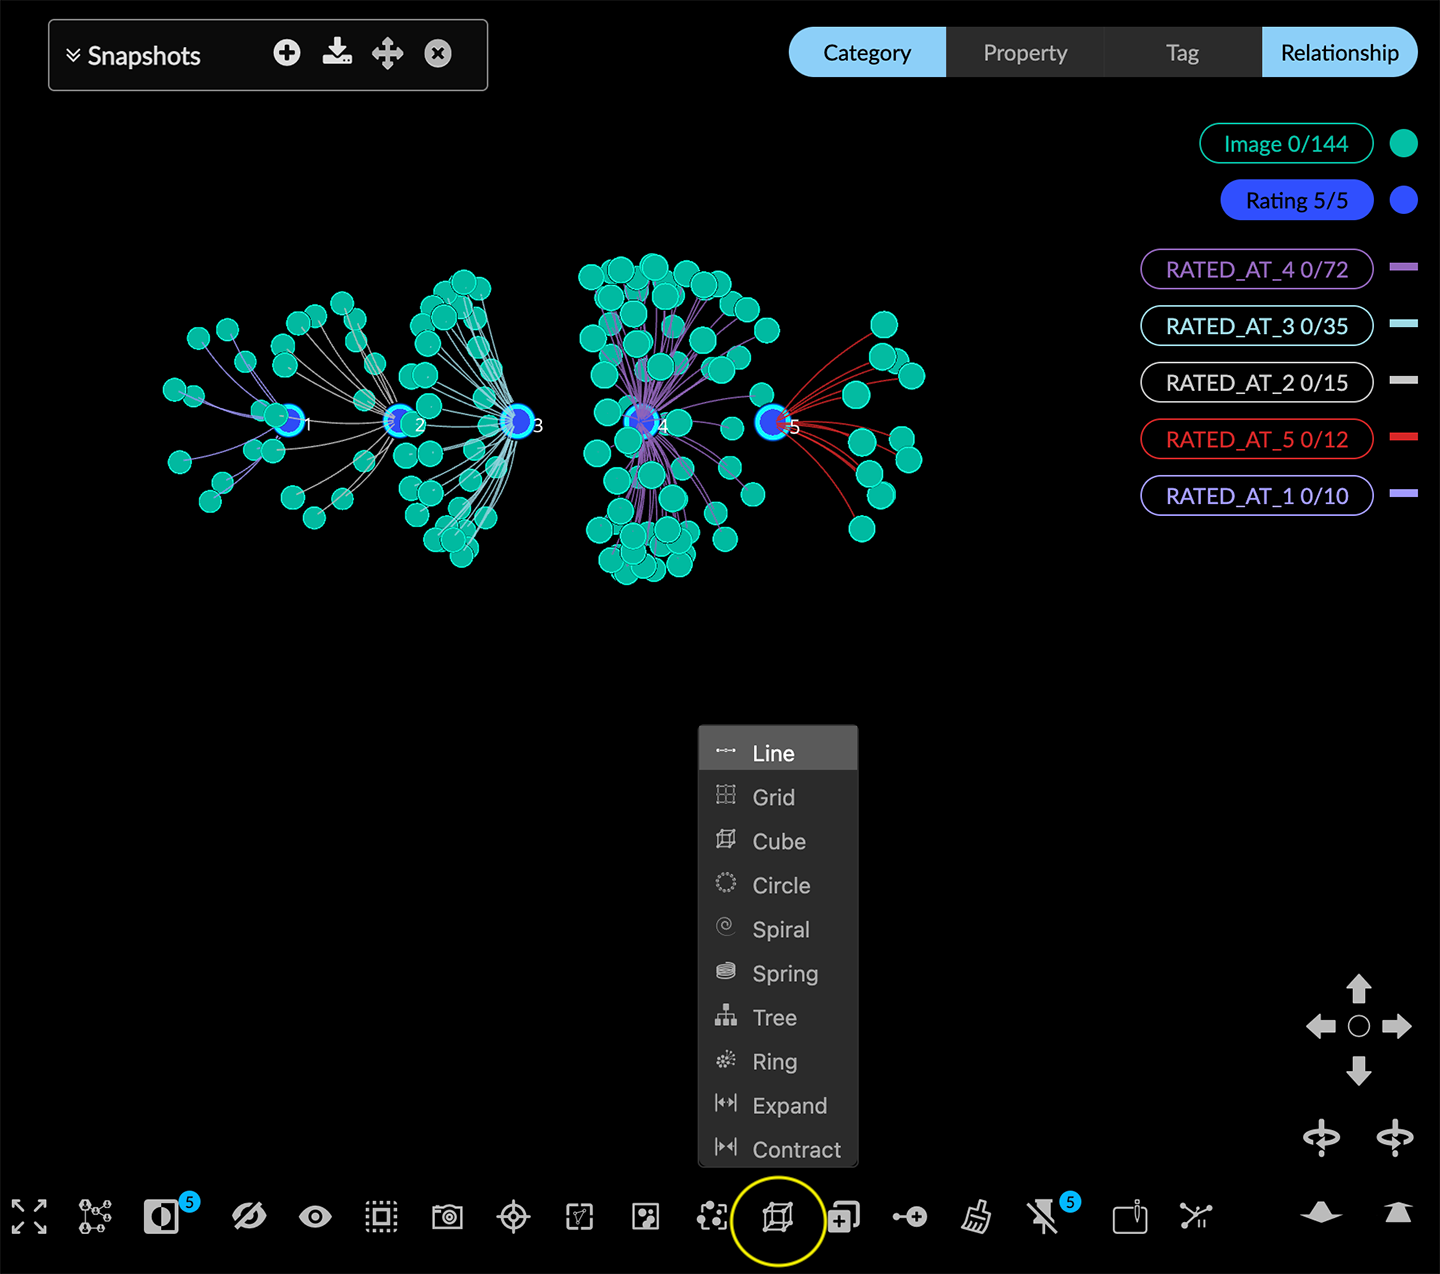
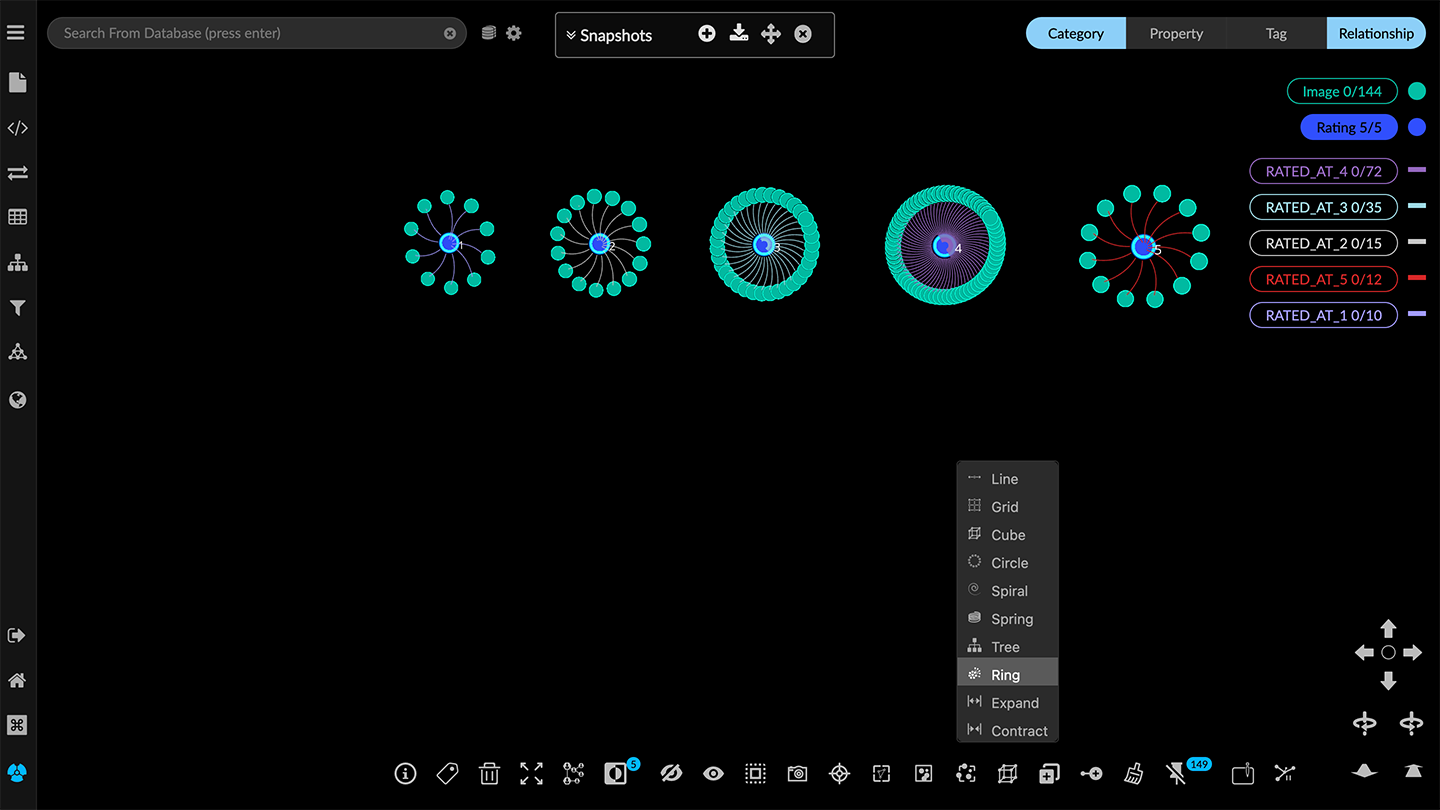
Apply a Line, Grid, Cube, Circle, Spiral, or Spring layout to any selection of nodes.
Apply a Ring or Tree hierarchical layout. You can select central nodes, but it is not required. If you apply the layout to all the data, GraphXR will determine the nodes most likely to be central. For simpler graph patterns, selecting central nodes first may not make a difference.
Expand or Contract the layout of any selection of nodes.
The Quick Layout menu does not enable ordering nodes in a geometric layout by property value.
It also does not include Shift or Rotate controls, but you can reposition selected nodes using navigation controls (e.g left-click drag to shift or right-click drag to rotate.)
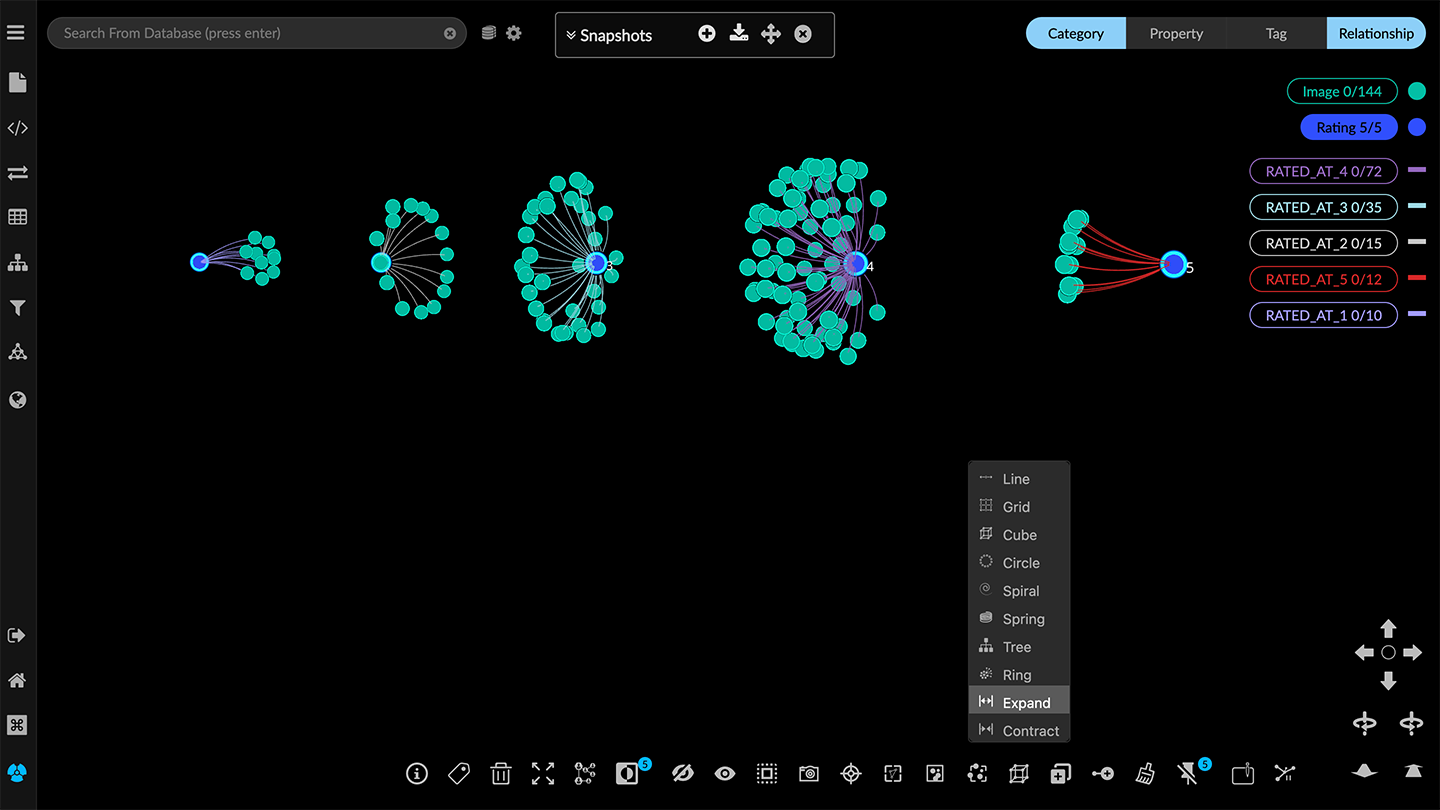
To create a Quick Layout:
Select nodes using any selection method and click the Quick Layout toolbar icon or Layout in the right-click menu to display the quick layout menu.
Select one of the quick layout options (for example Line).
With the nodes still selected, you can click Expand or Contract on the menu to adjust the size of the layout.
TIP: If you need space for hierarchical rings or trees in an initial geometric layout, adjust the layout first, then apply the additional hierarchical layout.
With the nodes still selected, choose Ring or Tree.
Selecting Expand or Contract in the above ring layout expands or contracts only the selected central nodes, not the rings.