Using GraphXR
Introducing GraphXR
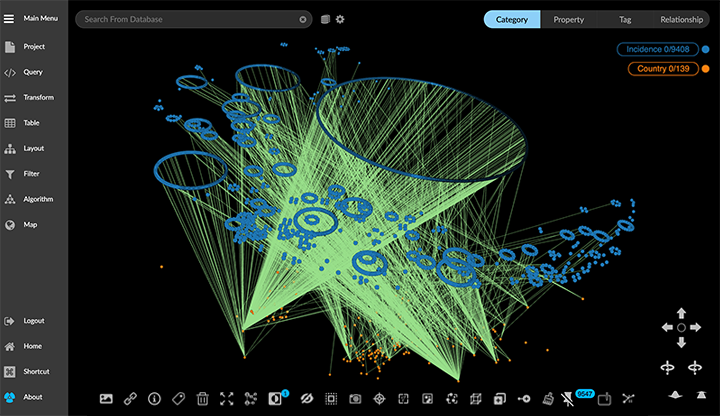
GraphXR is a browser-based visualization application that brings unprecedented speed and flexibility to the exploration of graph data. In GraphXR data are represented as nodes connected by edges in an interactive virtual 3D graph space.
With GraphXR you can:
Seamlessly import graph data from a graph database or other source (Neo4j via Cypher, RDBMS via SQL, CSV, JSON, Azure DB via Gremlin, etc.).
Navigate, select, and edit data efficiently in the graph environment.
Model data dynamically using data mapping, and a powerful suite of data transforms.
Explore graph connections through widely used graph algorithms, including PageRank and Shortest Path.
Visualize data in the graph space through parametric and geometric layouts, geospatial mapping, and time series display.
Save, share, and export data as a view, snapshot, Neo4j database, or flat table.
Supported Environments
WINDOWS, MAC OSX, AND LINUX
CLOUD, PRIVATE CLOUD, AND ON-PREMISES DATA HOSTING
OCULUS RIFT, HTC VIVE, AND WINDOWS MIXED REALITY
The GraphXR client runs best in Google Chrome. Compatibility with other browsers may vary.
The GraphXR client includes beta support for Virtual Reality (VR) hardware in the Google Chrome browser via WebXR.
GraphXR Cloud and Pro editions support local and cloud storage. In addition, GraphXR Enterprise is available via on-premises or private cloud deployments.
For more information, please contact Kineviz.
New in GraphXR 2.16
The GraphXR 2.16 release includes new user interface design and functionality as follows:
Redesigned Right-Click menu. Most toolbar items are included. Those with related functions are now in Select, Actions, and Layout submenus. New functionality:
A new Find Path menu item provides Trace Path function similar to that provided in the Algorithm panel.
The new Actions>Change Category menu item lets you change the category of any selection of nodes.
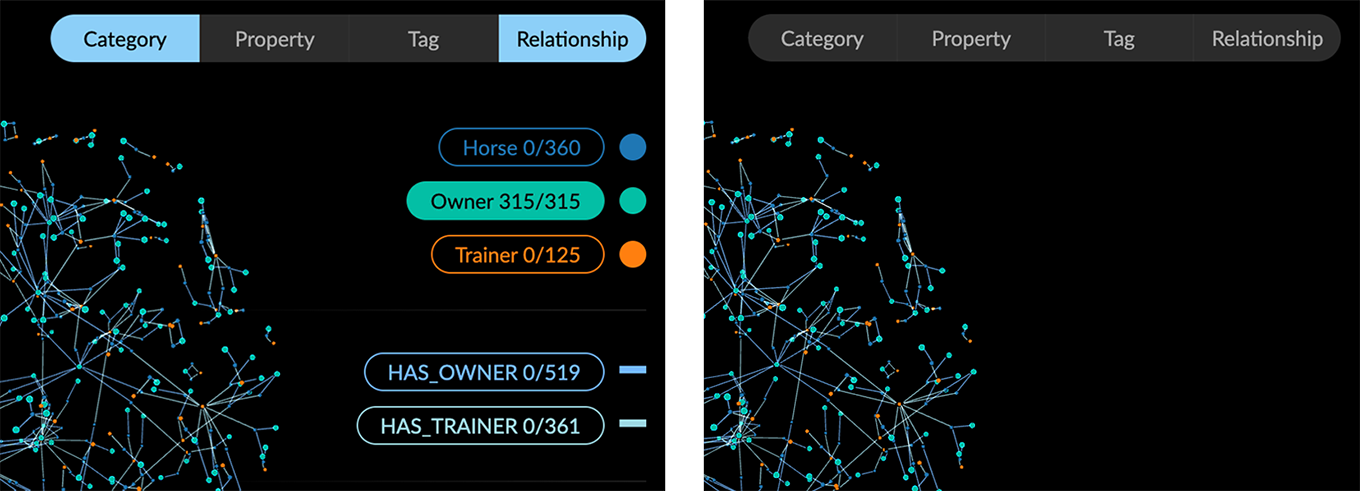
Improved Legend.
Category, Relationship, and Property lists can be hidden by clicking the item on the Legend.
Ctrl-click to select more than one Category, Relationship, Property, or Tag from the list.
Styling dialogs now include additional Avatar, Size, and Caption tabs for categories, Bind Width and Caption tabs for relationships, and color picker for individual properties and tags. You no longer have to open the Settings panel to access these controls.
Edges can be colored by property (GXR-468: To Do)
Filter Enhancements
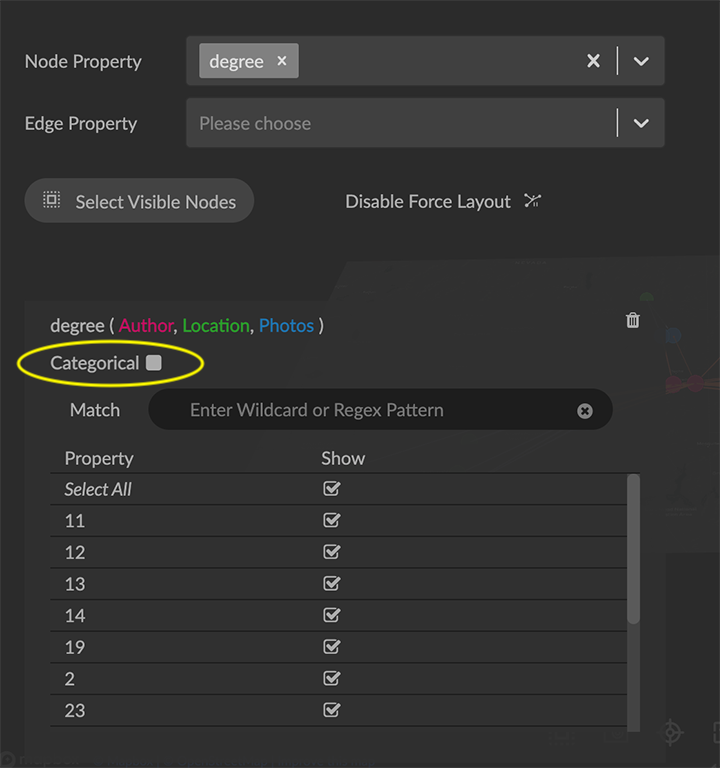
Filter categorical (text string) property values. Node or edge property values which are text strings (as opposed to numerical, date or lat-long values) can now be filtered. A categorical filter displays a list of the unique string values found in the selected property. Selection checkboxes are provided, as well as a Match function to filter data using a search string or regular expression.
Filter continuous (numerical) values as categorical ones. For numerical property values, a Continuous / Categorical toggle lets you filter numerical values as text strings. This can be useful for filtering properties with integer numerical values.
Select Categories or Relationships to be filtered. When a property name is used in more than one category (or relationship) the filter displays an active list you can use to select the labels to be filtered.
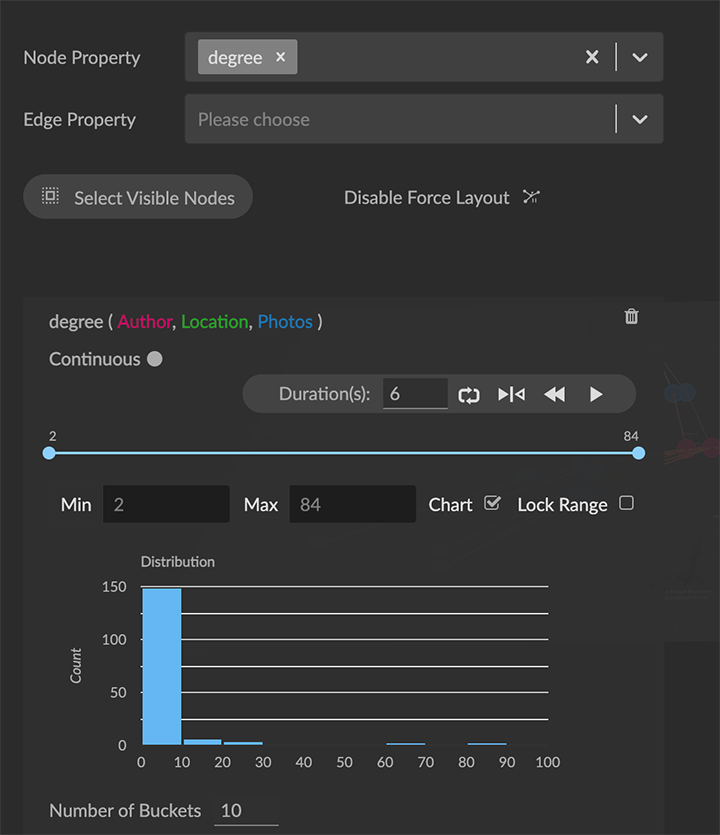
Chart. For continuous filters (numerical, date, latitude, or longitude property values), a live histogram (bar chart) of the data being filtered is displayed by default. The Chart checkbox lets you hide or show the histogram, and a Number of Buckets selector is provided to set the maximum number of bars in the chart.
Named and parameterized Cypher queries. In the Query>Cypher panel, users can create named Cypher queries that include a descriptive name and optional input parameters. Once stored to the project, queries are available in shared projects and data views. This enables the creation of a set of standard queries that can be used by any of the project’s users.
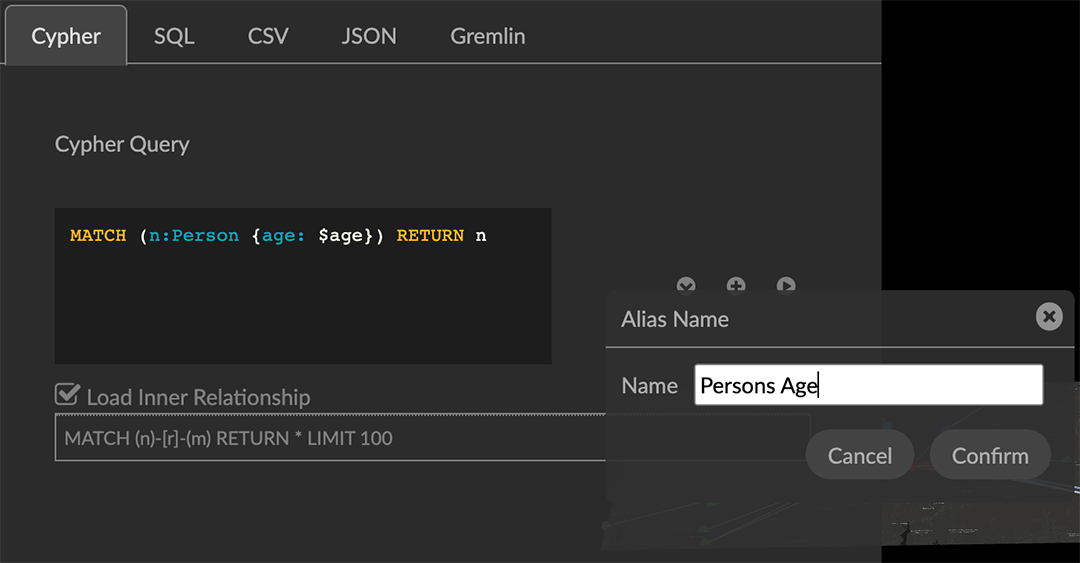
The + button to add a Cypher query to the collection of stored queries opens an Alias Name dialog asking you to enter and confirm a name when storing the query.
Stored queries are listed in the Query panel. As soon as they are stored on the project, other project users on other machines can access and run them.
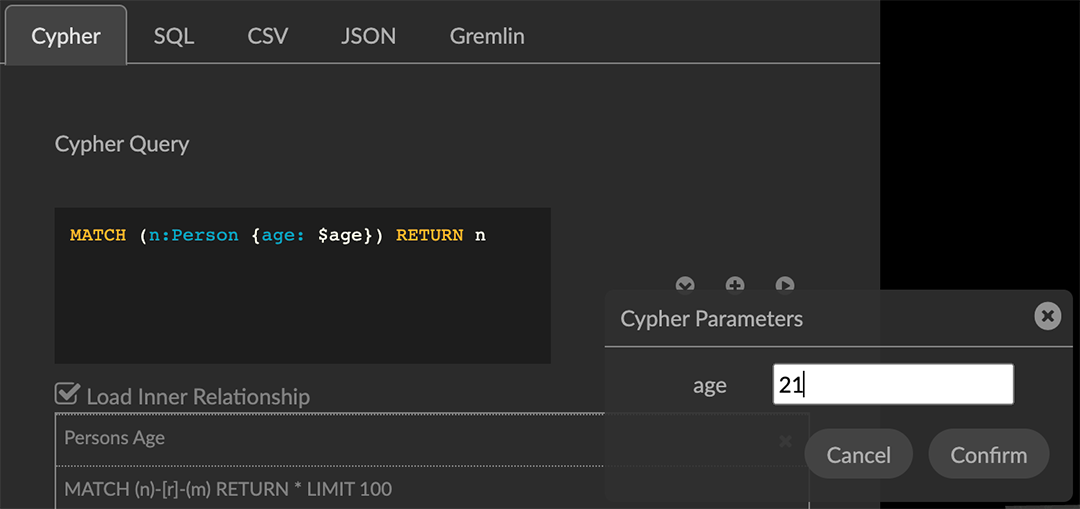
A query can be parameterized by using the special syntax
$paramin the query definition. For example:MATCH (n:Person {age: $age}) RETURN n
See Parameters - Cypher Manual for details.Running a query that includes parameters displays a dialog asking the user to enter appropriate values for the parameters. Optionally, a shared view on the project can run a query by specifying the name of the query and key value pairs for the parameters.
Map Enhancements. Map configuration details persist (including map boundaries set using Map Control) and are saved in data views, snapshots, and .GXRF export files.
Navigation, Selection, and Visibility Enhancements.
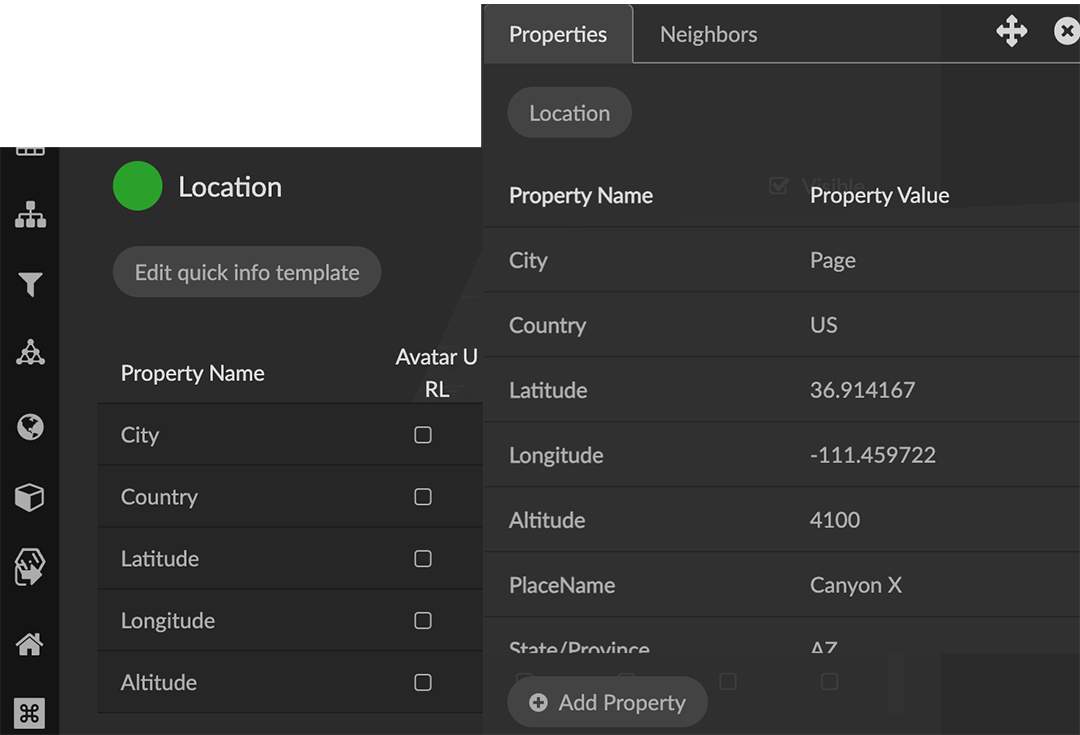
Properties of a Category or Relationship, which by default are displayed in alphabetical order, can be re-ordered in the Project panel by clicking arrow icons that appear on rollover at the left edge of the property list.
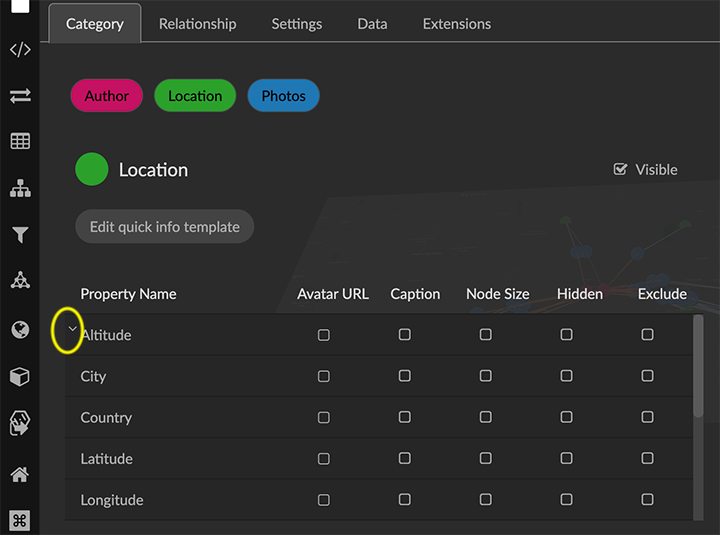
The new order is immediately updated in information windows.
Double click a node or edge to display its information panel.
Deleting a node closes its Information window.
Edges can be selected more easily.
Additional shortcut keys
Orbit around x, y, or z axes:
x: ctrl+alt+shift+o (Mac); ctrl+alt+shift+o (Windows)
y: ctrl+o (Mac); shift+o (Windows)
z: ctrl+shift+o (Mac); alt+shift+o (Windows)
Select all orphaned nodes: shift+D
Improved Security and User Access. Data views include optional password protection.
Performance.
Extract works for more than 50,000 nodes.
Faster response for Quick Information rollovers.
Improved CSV parser
Project Configuration (Admin)
Create Admin user on startup.
Creating Projects streamlined.