Working in a Project
A GraphXR project represents a 3-dimensional, functionally infinite space that includes the full capability to navigate, edit, and visualize graph data. When you first open a project, its space is empty. You can:
Import data by drag and drop, data mapping, or query.
Navigate, inspect, search, select, filter, add and delete, and edit data.
Create, refine, or extend a graph data model directly in GraphXR.
Run widely used graph algorithms such as Path Finding and Centrality.
Intuitively visualize data in the 3D space using:
Customized layouts, including Parametric 2D or 3D scatter plots, Geometric Line, Circle, Grid, Cube, and Spiral layouts, Tree layouts, and more.
Filter or distribute nodes on date, time, and other numerical properties.
Geospatial maps, for nodes with latitude and longitude properties.
Save and share graph data to data Views, Snapshots, GXRF or CSV archives, or to a connected Neo4j database. You can also save and export a data mapping as a JSON file.
On the desktop, a set of menus and controls provide the tools you’ll need to work with graph data:
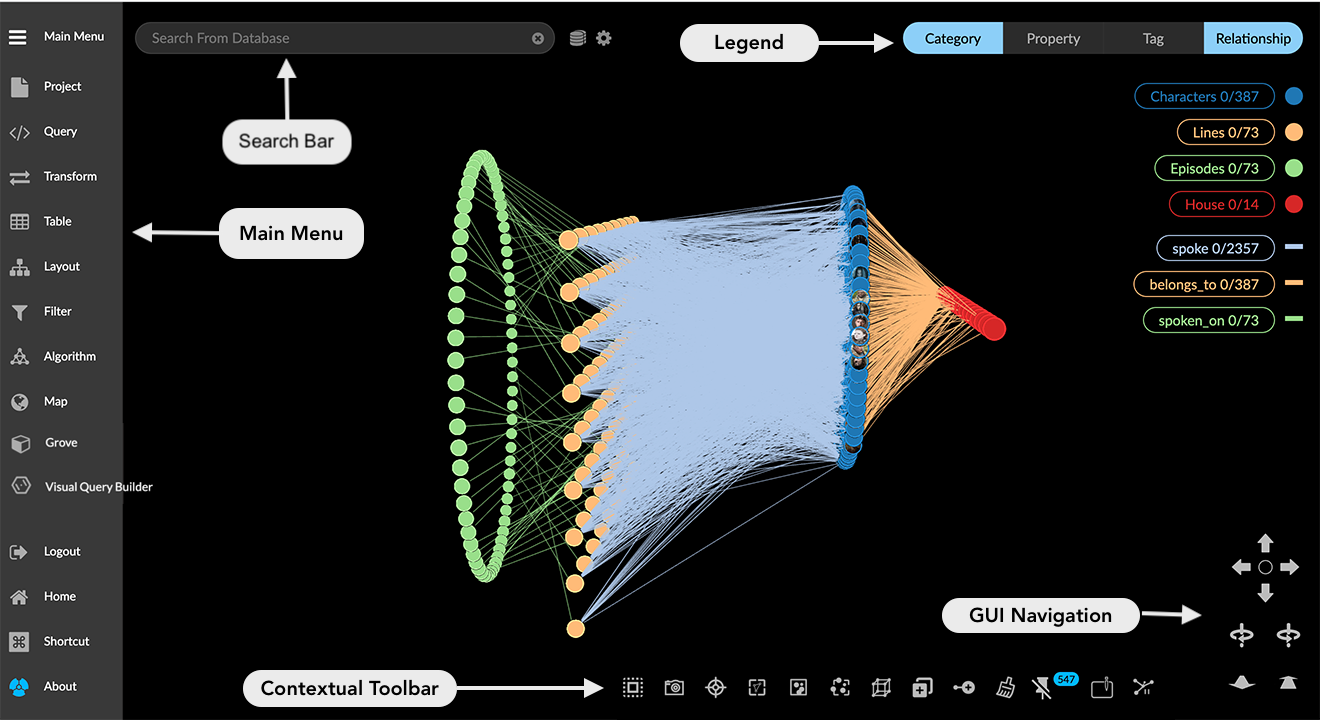
A Main Menu along the left vertical edge of the project space, to open panels for importing, transforming, and displaying data.
A Search bar at the top left, to perform full-text search on either indexed data in a connected Neo4j database, or on the data in the project space.
A Legend, along the top right side of the space, to select nodes by category, tag, or property, and edges by relationship.
A context Toolbar, along the bottom of the space, to display the tools available to use on the data currently present and/or selected in the graph space.
A set of GUI Navigation controls, at the bottom right, to enable 3D navigation within the graph space. GraphXR can also be used with WebX-connected virtual reality (VR); these controls let you emulate the VR experience to some degree on the desktop.
Main menu
The Main menu on the left edge of the graph space gives access to menu panels. Most panels are further divided into tabs. Simply click an icon to display its panel.
Mouse over an icon to display its label, or click the Main menu icon at the top left to show or hide the icon labels.
The Main menu panels are:
Project panel, to review graph entities, set preferences, import and export data, and access extensions.
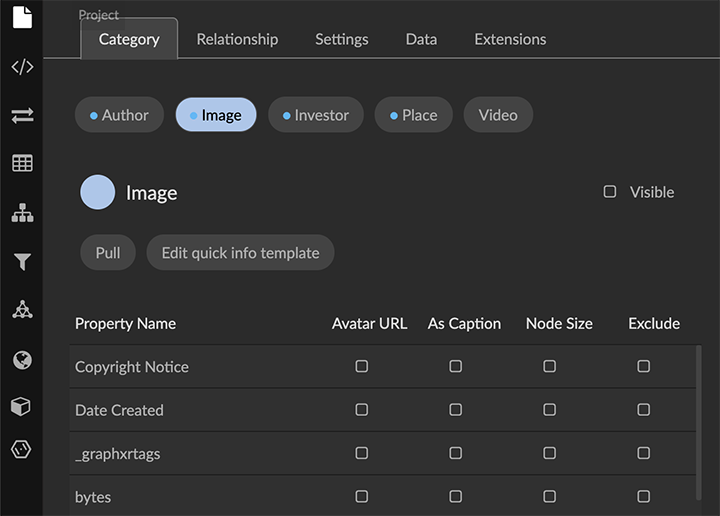
Tabs include:
Category and Relationship tabs, to enable you to pull specific types of nodes or edges from the database, set display preferences, and inspect and re-order the list of properties.
Settings tab, to control the size scale, display mode, and captioning of nodes and edges, to set 2D Mode, show or hide the Snapshot dialog, switch to a different Neo4j Database, and modify the project UI Configuration.
Data tab, to import data in standard formats such as CSV and GXRF, save data as a CSV archive, GXRF, or Neo4j database, and to save GXRF data views to the server.
Extensions tab, to access standard or custom extensions which may be available.
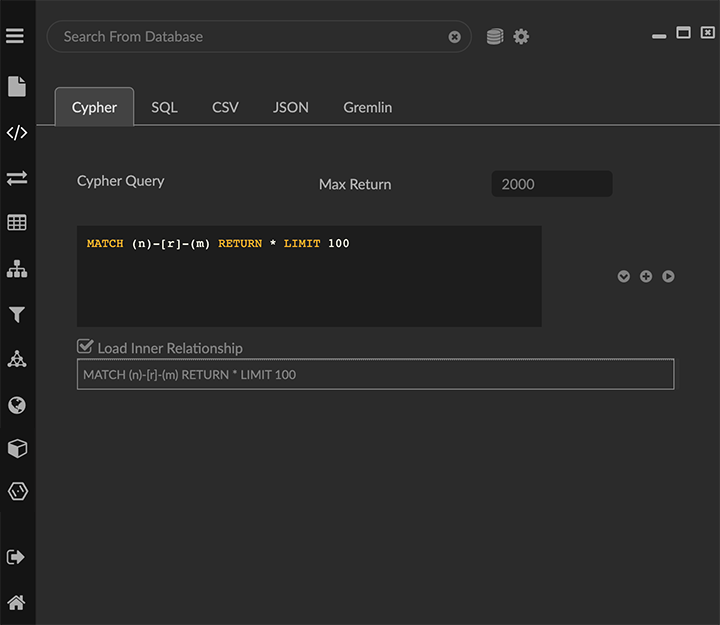
Query panel, to enter and save Cypher queries on a Neo4j database, and to run queries on a SQL database, CSV file, or a JSON or Gremlin environment. The SQL and CSV tabs include the Mapping Editor to create mappings that transform data in a flat CSV file or SQL table into a specified graph model.
Transform panel, to transform graph data directly in GraphXR.
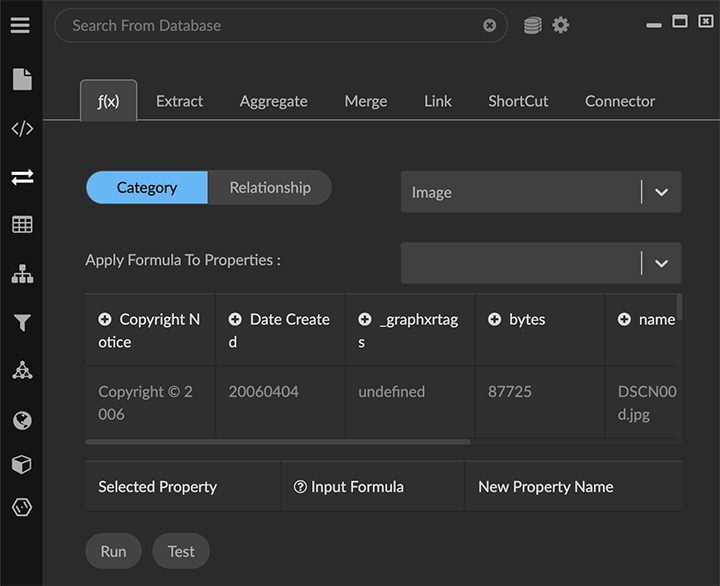
This powerful suite of data operators includes:
f(x), to execute functions similar to formulas in Excel and SQL, and functions in MapReduce frameworks. Use this to run mathematical formulas that transform one column of data to another, or that change data from one format to another.
Extract, to extract properties from existing nodes into new nodes and relationships, creating a new category and relationship in the process.
Aggregate, to collect properties from a starting node's neighboring edges and nodes, apply a calculation, and write the result back to the starting node as a property.
Merge, to combine two nodes with matching properties into a single node.
Link, to connect nodes with the same property values. This can be used to bring two different data sets together, and also to draw explicit connections among nodes of the same type.
Shortcut, to connect two nodes that share a common neighbor with a new link. You can use this to simplify the graph.
Connector, to provide access to external applications for enhancing or transforming data.
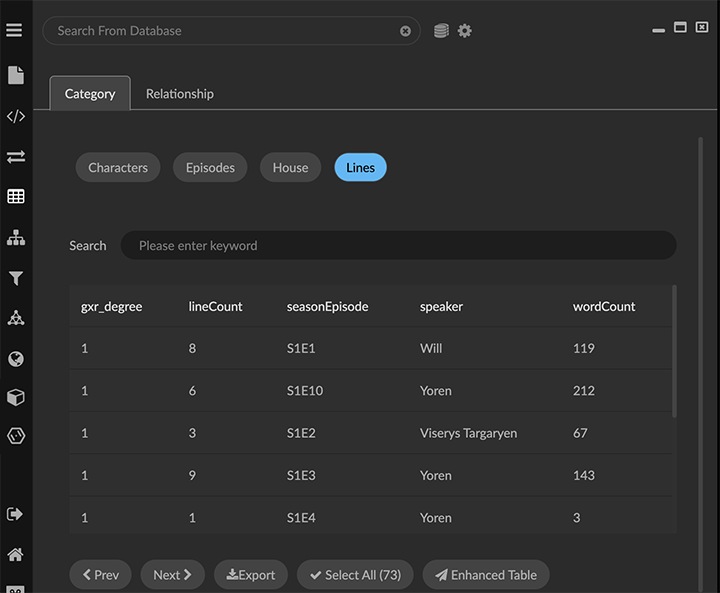
Table panel, to view data by Category or Relationship in a searchable tabular format. Enhanced Tables let you rename categories and relationships on the fly, select, sort, edit, reformat, and then export the data in the edited table.
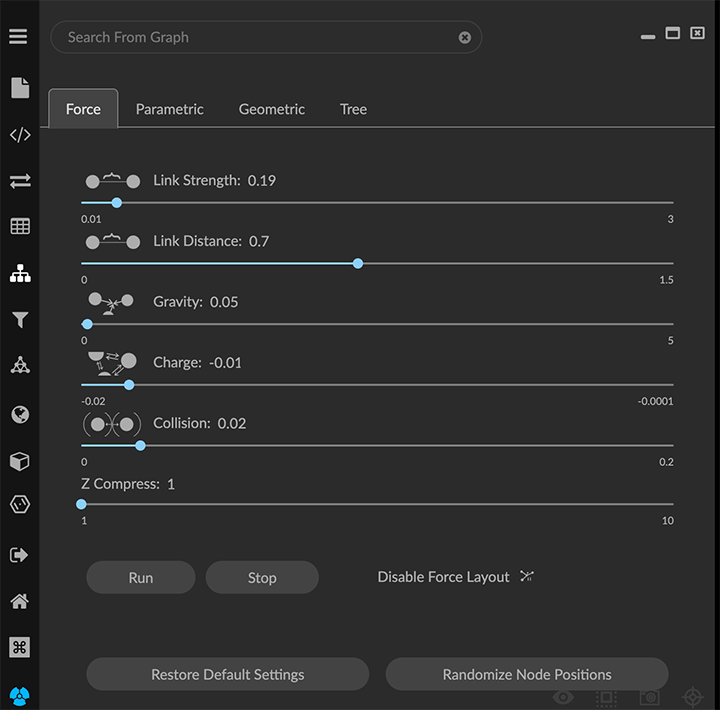
Layout panel, to apply Force, Parametric,Geometric, and Tree layouts to all or part of your data.
Filter panel, to filter data by Node or Edge properties using multiple composable filters
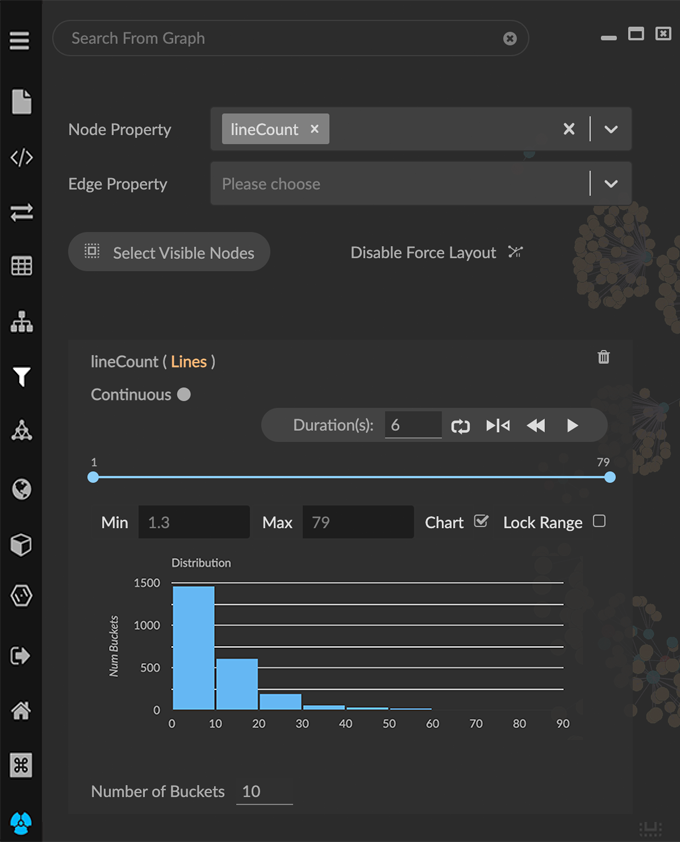
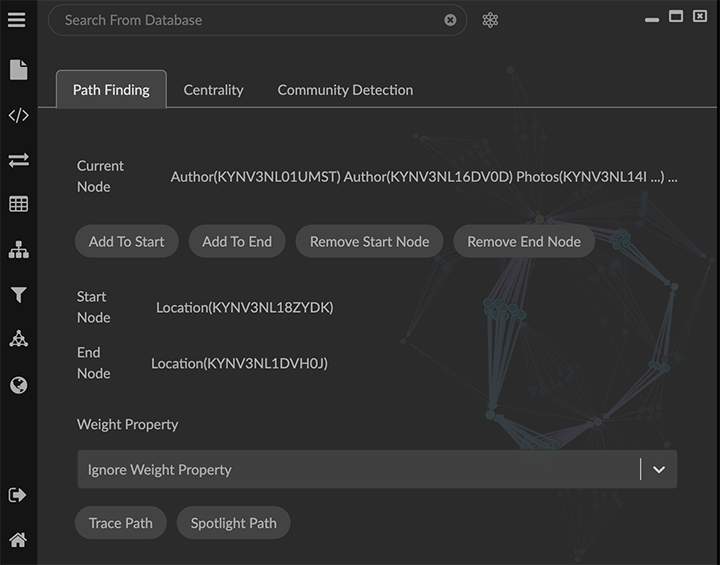
Algorithm panel, to run Path Finding, Centrality, and Community Detection graph algorithms and add the result to nodes or edges as a property value.
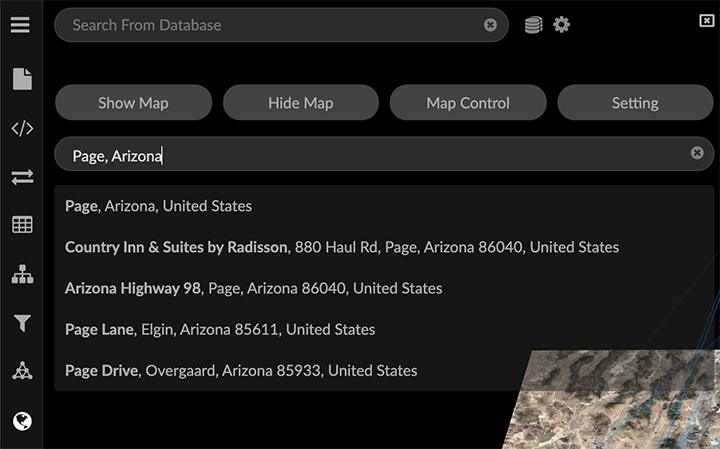
Map panel, to work with geospatial data on a world map. Nodes with latitude and longitude coordinates are automatically dropped onto the map.
Additional functions provided at bottom left of the project space are:
Logout, to log out of GraphXR.
Home, to return to the Projects page.
Shortcut, to display keyboard and mouse shortcuts available for efficient navigation and data selection on the desktop. For details, see Shortcut Keys Reference.
About, for GraphXR version information.

Search Bar
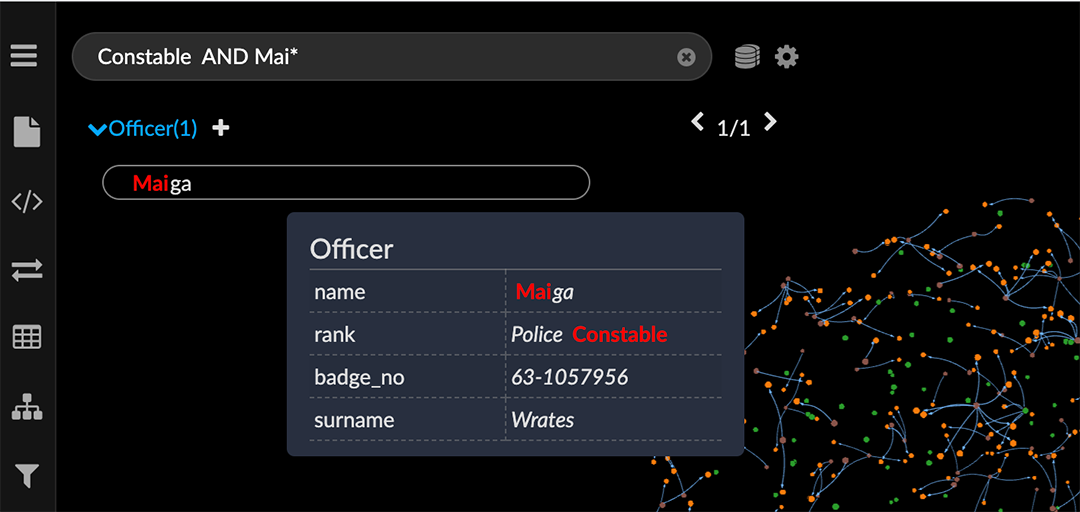
The search bar at the top left lets you perform full-text search either on the indexed property data in a connected Neo4j database, and import the resulting nodes to the graph, or on the data already in the project space. The icon to the right of the search bar lets you toggle between the database or the current graph.
You can click the additional settings icon to the right to set indexed database properties using the Search Index Configuration dialog.
Search results are listed by category below the search bar. Click a single node or a group of nodes in the search results to import the data from the database, or to select nodes which are already in the project space.
Legend
A legend at the top right corner of the project space lets you review and select data by Category, Relationship, Tag, or Property.
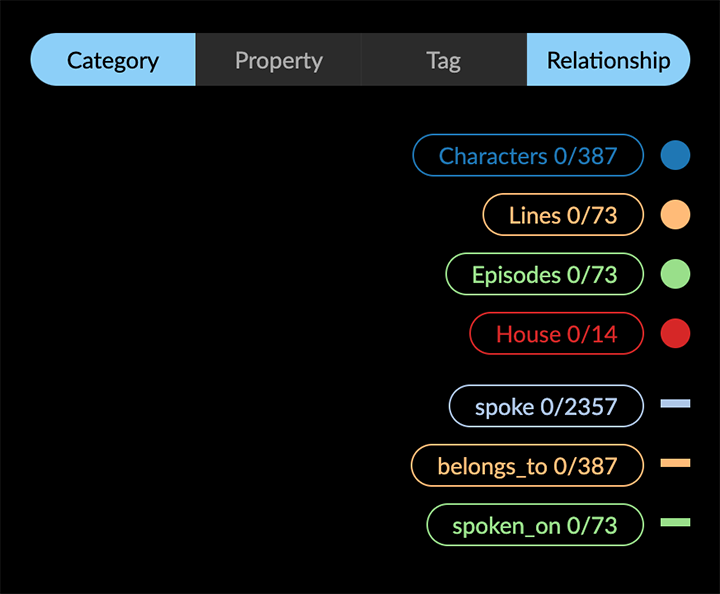
Select Category, Tag, or Property to display a list of categories, tags, or properties present in the data, and the number of currently selected and total nodes for each. Likewise, select Relationship to display a list of the relationships in the data, and the number of currently selected and total edges for each. When you display relationships at the same time as categories, properties, or tags, the relationships are listed below. You can:
Monitor how many nodes of each category, tag, property (or edges of each relationship) are currently selected. Adding or subtracting from a selection immediately updates the numbers.
Click a list item to select all the nodes for a category, tag, or property, or all the edges for a relationship. Use ctrl-left click to select multiple items.
Click the colored line or dot next to a list item to style the nodes of a category, property or tag, or the edges of a relationship. For a category, you can set Color, an Icon, and select properties that provide information for one or more Captions, an Avatar url, and relative node Size. For a relationship, you can set the Color, and select properties for Captions and Bind Width (relative width of the edge). For a listed property value or tag, you can set a Color or an Icon.
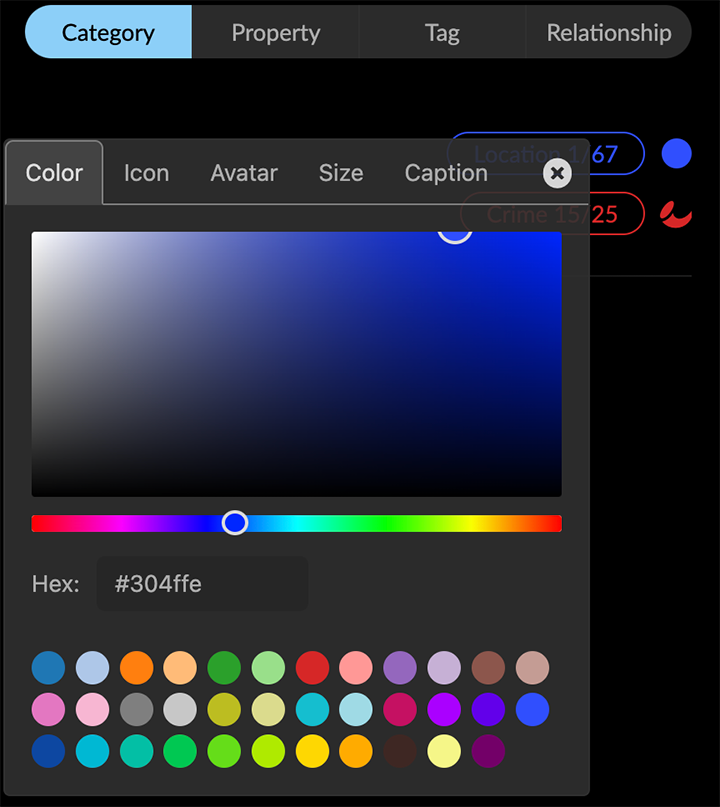
For details on selecting colors and icons, see Selecting Colors and Labels.
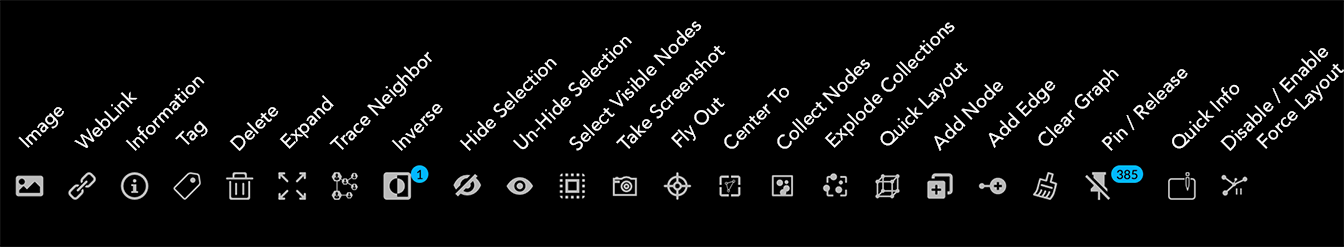
Context Toolbar
The context toolbar at the bottom edge of the graph space displays icons for actions available for the data currently present and/or selected in the graph space.
Some tools are available only when you select more than one node or edge, and some only when you select a single node or a node that has an associated url and weblink property.
Before you load any data, the context menu items are:

Add Node. Displays a dialog to define and add a single node.
Quick Info. Toggles between turning on and off Quick Info rollovers for nodes and edges.
Disable/Enable Force Layout. Toggles between turning on and off a force directed physics layout.
Once you load or create at least one node, more tool icons appear.

Select Visible Nodes. Selects all nodes currently visible in the graph space (i.e. those not hidden using Hide Selection or by de-selecting the Visible checkbox for a category or relationship in the Project panel).
Take Screenshot. Takes a .png screenshot of the graph space including the legend, but excluding an open panel, toolbar and GUI navigation controls.
Center To. Zooms in on the center of the graph data if no nodes are selected, or the center of a group of selected nodes, or a single selected node.
Fly Out. Zooms out to display all the graph data centered in the project space.
Collect Nodes. Collects nodes connected to selected nodes by only one edge, and places them in special collection nodes. The information panel for a collection lists the included nodes, and enables you to remove or add back nodes.
Explode Collections. Deletes selected collection nodes and restores the included nodes to the graph space.
Quick Layout. Displays a menu to lay out selected data in basic Line, Grid, Cube, Circle, Spiral, or Spring layouts, and to create a hierarchical Tree or Ring layout around selected nodes.
Add Node. Displays a dialog to define and add a single node.
Add Edge. Displays a dialog to add edges between selected nodes, either with an existing relationship or by creating a new one.
Clear. Removes all data from the graph space.
Pin or Release. Toggles between pinning nodes to a location in the space, or releasing nodes from being pinned. The badge on the icon shows how many nodes are currently pinned.
Quick Info. Toggles between turning on or off Quick Info rollovers for nodes and edges.
Disable/Enable Force Layout. Toggles between turning on and off force directed physics layout.
When you select any set of nodes, you see additional icons that operate on selected data:

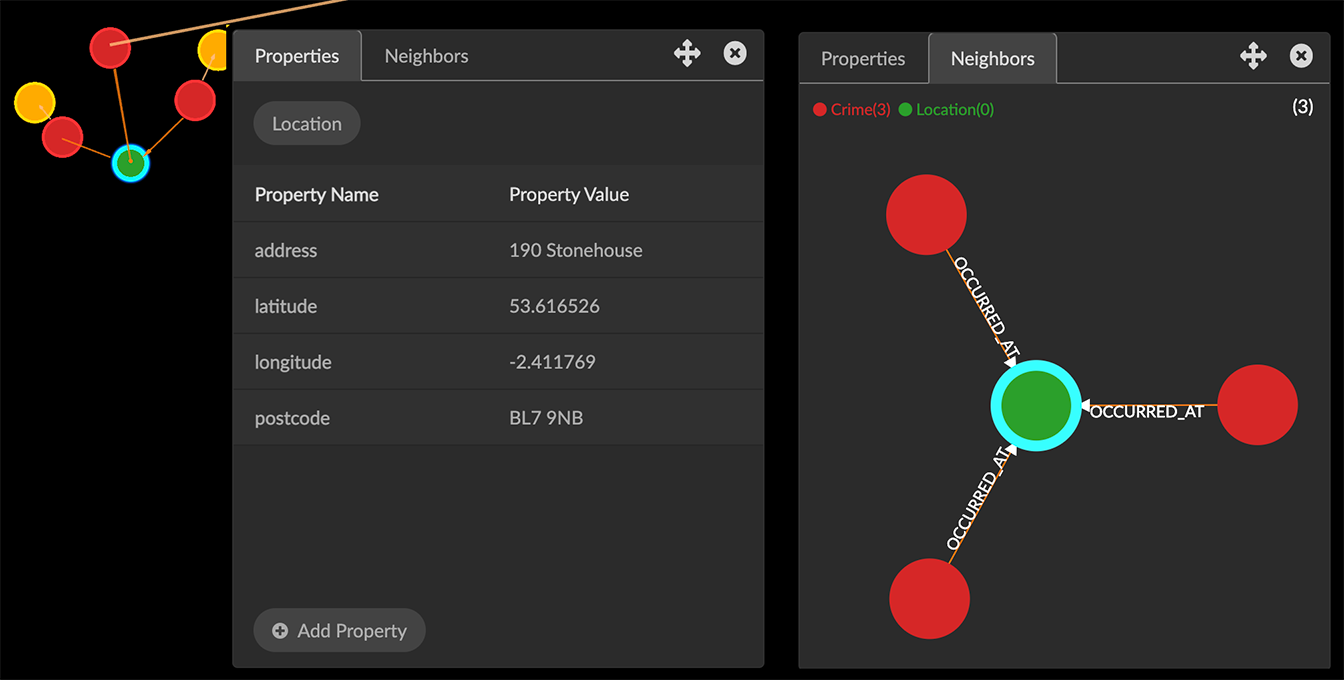
Information. Opens an information window for the most recently selected single node or edge which shows detailed information about a node's Properties and Neighbors or a relationship’s Properties. If desired, you can add properties and their values in this window.
Tag. Opens the Create Tag dialog to tag any set of selected nodes.
Delete. Deletes selected nodes and edges.
Expand. Opens the Expand with relationships dialog to pull additional nodes from the database which are connected to the selected nodes. You can select any or all of the relationships that connect the nodes.
Trace Neighbor. Displays a slider above the toolbar to display nodes connected through the number of steps you choose.
Inverse. Selects all nodes not currently selected. The badge at the upper right of the icon shows how many nodes are currently selected.
Un-Hide Selection. Displays after you select and hide nodes. It restores all hidden nodes and edges to the graph space and de-selects them.
Hide Selection. Hides selected nodes and edges temporarily.
When you select a single node, you see additional icons:

Image and WebLink. These two icons appear if an image and/or url is attached to a node. Select a node and click Image to display a small image in the graph space close to its node, and click again to hide the image. Click WebLink to open a browser window to a linked image or webpage.
Information. Opens a floating information pane for a selected single node or edge. Its Properties tab lists the properties of the node or edge. If desired, you can add properties and edit property values in this window. Its Neighbors tab displays a count of nodes connected to the selected node through one edge, and a live graphic of the nodes and edges.
Right-Click Contextual Menu
A floating contextual menu of tools available for your current selection is available by right-clicking anywhere in the space. This menu makes it easier to navigate and edit the graph without using the toolbar or opening additional panels. In addition, it can be customized as needed.
The default right-click menu, includes the following often-used tools at the top level: Information, Add Node, Add Edge, Expand, Find Path, Center To, Fly Out, and Delete.
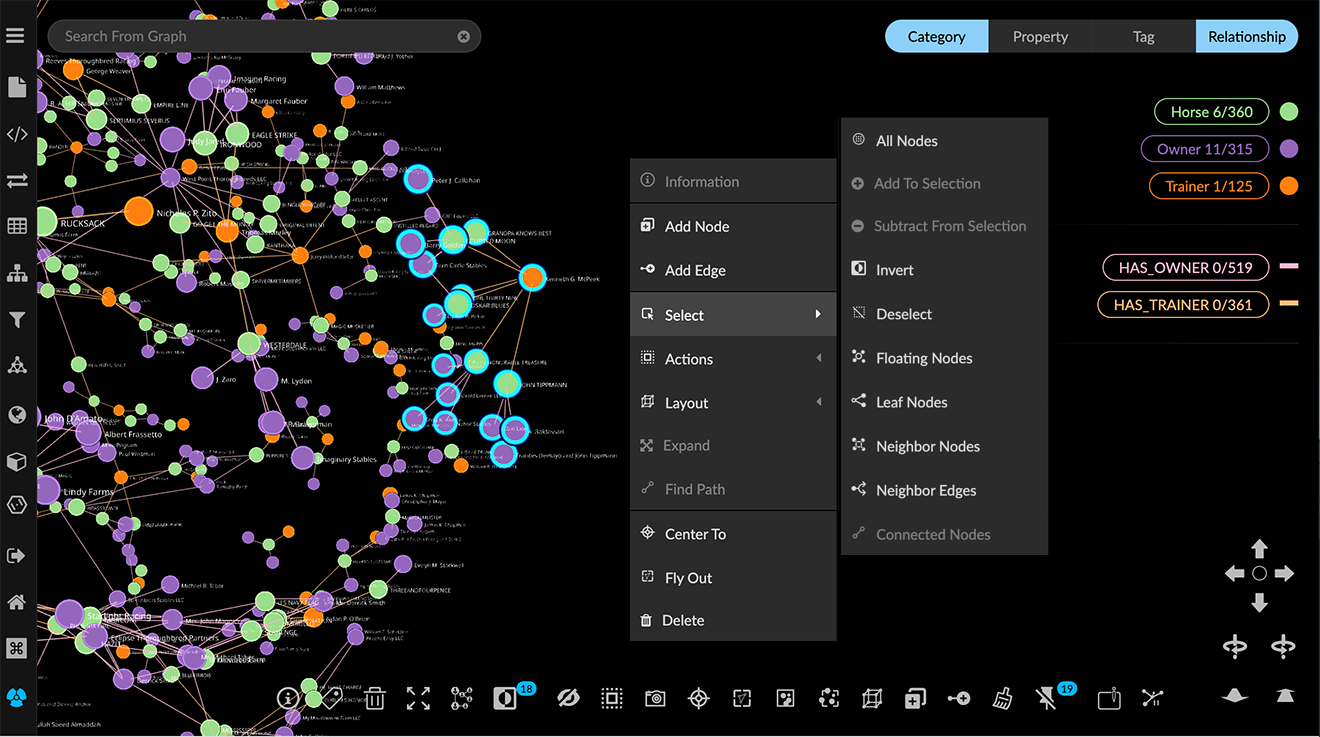
Its Select, Actions, and Layout submenus organize tools further as follows:
Select: All Nodes, Add to Selection, Subtract from Selection, Invert, Deselect, Floating Nodes, Leaf Nodes, Neighbor Nodes, Neighbor Edges, and Connected Nodes.
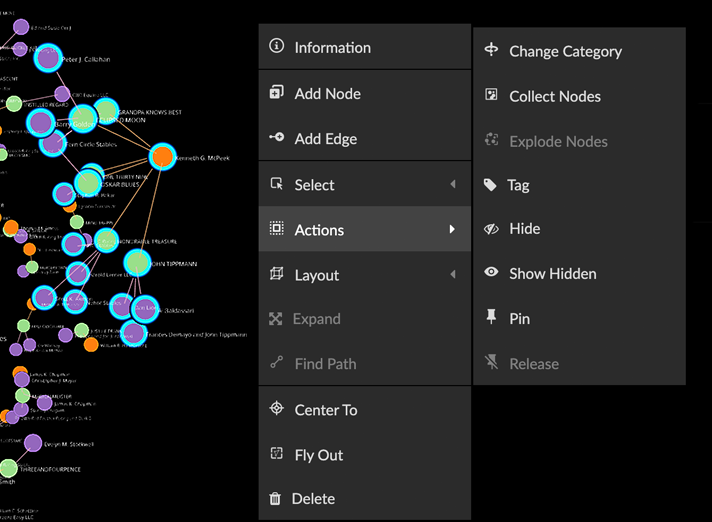
Actions: Change Category, Collect Nodes, Explode Nodes, Tag, Hide, Show Hidden, Pin, and Release.
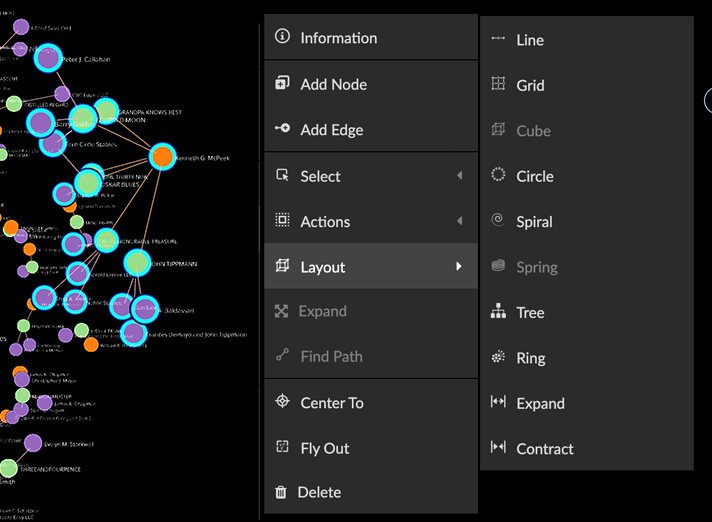
Layout: Line, Grid, Cube, Circle, Spiral, Tree, Ring, Expand, and Contract. In 2D mode, the 3D Cube and Spring layouts are grayed out.
By default, Quick Information, Disable/Enable Force Layout, Clear All, Screenshot, Link, and Image items appear only in the toolbar.
Most, but not all, of the functions provided in the right-click menu are available in the toolbar or one of the main menu panels. Those not available elsewhere are:
Find Path, similar to the function in the Algorithm>Path Finding tab. It finds a path between just two selected nodes.
Select submenu:
Floating Nodes. Nodes with no connecting edges.
Leaf Nodes. Nodes with only one connecting edge.
Neighbor Nodes. Nodes one hop away from selected nodes. Choose again to select nodes another hop away. This is similar to the Trace Neighbor tool, except that one hop at a time is found and the nodes are selected, not just highlighted.
Neighbor Edges. Nodes one edge away from selected nodes.
Connected Nodes. Nodes connected to selected edges.
Actions submenu:
Change Category. Displays a dialog that lets you immediately change the category of any selection of nodes to any other existing category or to a new category. Properties of the changed nodes that are not present in the target category will be transferred.
Actions>Change Category cannot be undone with Ctrl+Z. Before using it, you should save a data View, snapshot, or .GXRF file. This will enable you to revert a mistaken change.
GUI Navigation Controls
The GUI navigation panel at the bottom right of the graph space provides simulated Virtual Reality (VR) controls for use on the desktop.
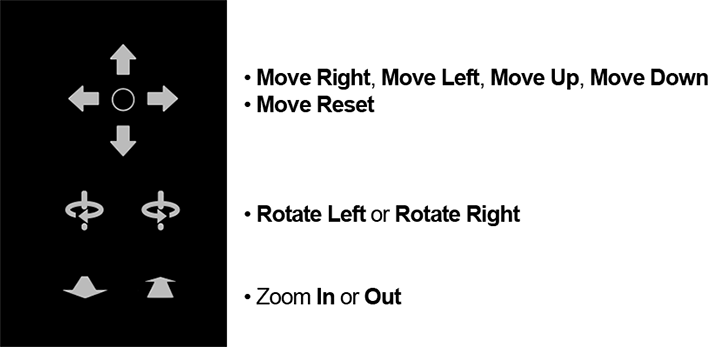
Click and hold the upper arrows to Move Right, Move Left, Move Up, or Move Down. Click the central circle to Reset the view to the center point of the data (similar to the Center To toolbar icon).
Click and hold the middle joystick-like controls to Rotate Left or Rotate Right.
Click and hold the lower arrow controls to zoom In or Out.
Keyboard and mouse shortcuts are also available for navigation controls. Click the Shortcut icon at the lower left edge of the project space to display a reference panel.