Reviewing User Analytics
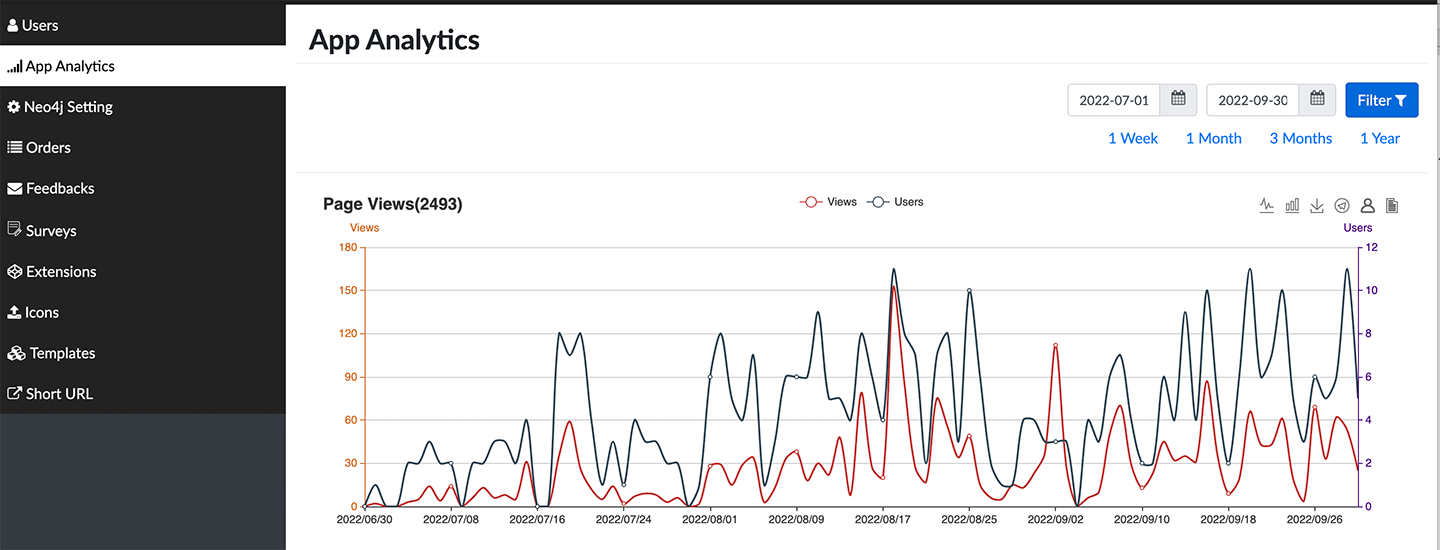
In the App Analytics panel you can review GraphXR usage in a variety of ways, including:
Filter analytics by time period.
Display usage on line or bar graphs or in lists.
Export analytic details in formats such as .CSV files or .PNG graphics.