Graph Data Basics
Graph data is a way of expressing information in terms of entities and their connections. The ability to model connections along with their direction and transitive connectedness (e.g. A to B to C to D) provides new ways to view, use, and extend data. The explicit emphasis on patterns can quickly yield intuitive insights that are difficult if not impossible to discover in a collection of tables or a hierarchical data structure.
Anatomy of Graph Data
Graph data can be modeled in a variety of ways. GraphXR uses a labeled property graph model in which graph data are expressed as one of three elements: nodes, edges, and properties.
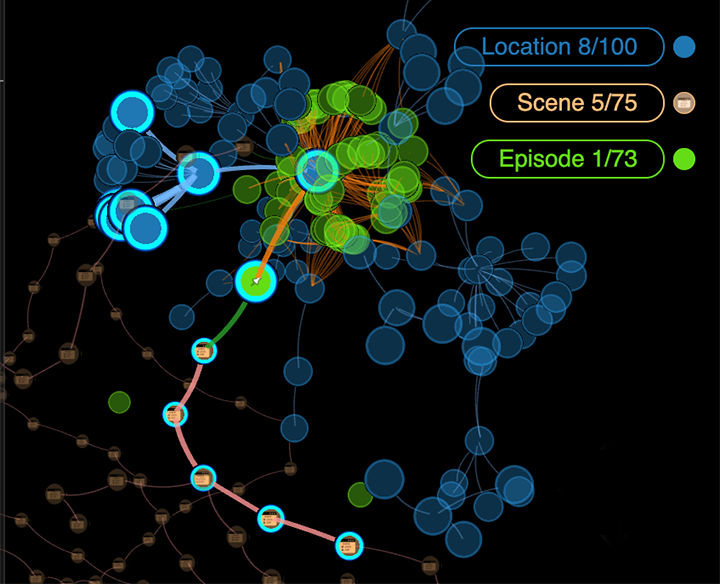
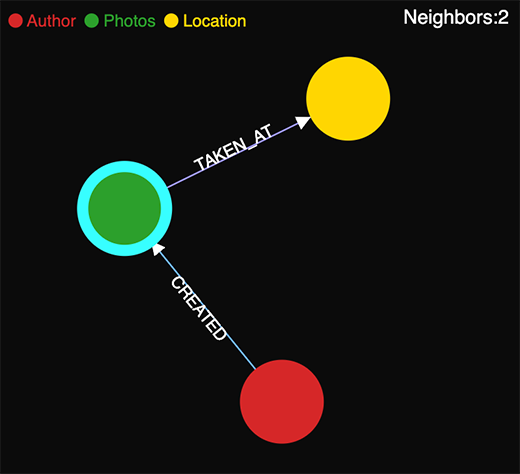
Nodes are entities that include data of a given type, for example, details about a person such as name, age, etc. Each node appears in the graph space as a circle. Nodes of a given type comprise a Category, and are identified by a text label such as Person.
Edges are entities that establish a defined connection. They are represented by a line connecting two nodes. The edges of a given type comprise a Relationship, and are identified by a text label such as such as PARENT_OF or PURCHASED_BY. Directed relationships such as PARENT_OF have an arrow at one end, while directionless ones such as FRIENDS_WITH do not.
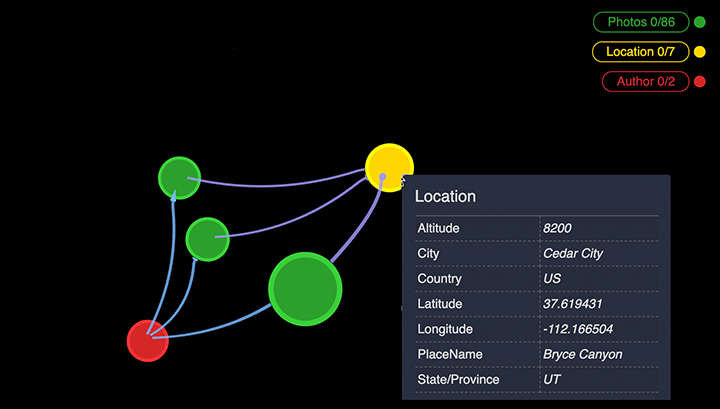
A labeled property graph includes defined properties, key-value pairs associated with nodes or edges through their defined categories or relationships. Properties include a key such as name or location, and an associated value. Property values can be in the form of numbers, text, geospatial coordinates, date or timestamps, or urls. Multiple values can be entered for a property. In GraphXR, property values can be displayed on nodes as captions, icons, or portrait images, and on edges as captions.
Categories and relationships define patterns by which nodes and edges connect to one another. Patterns and the properties of the nodes and edges involved can be explicitly viewed, analyzed, and transformed in GraphXR's virtual 3D graph space.
Graph Data Modeling
For graph data, the schema, or data model is both flexible and extensible. New categories, relationships, and properties can be added, and old ones re-defined in response to new data sources and new inquiries that arise as investigation and analysis goes forward.
Since data exploration and analysis is highly iterative, this is a powerful advantage. You can quickly re-cast data to look at existing data from different perspectives, and you can easily incorporate new data sources as you need them.
In addition, GraphXR’s Transform functions let you map properties to new nodes and relationships, and reduce data complexity by aggregating or merging data in various ways.
Sources of Graph Data
GraphXR enables you to work with multiple data sources. You can:
Pull or query graph data from a Neo4j graph database connected to GraphXR, or load data exported in a variety of formats from other graph databases (or another GraphXR project). Data exported from a graph environment will include its defined categories, relationships, and properties.
Import data in CSV, JSON, and many other formats simply by drag and drop. When you import data that has no associated graph schema, such as a flat CSV file, each row in the table is imported as a node of a single default category.
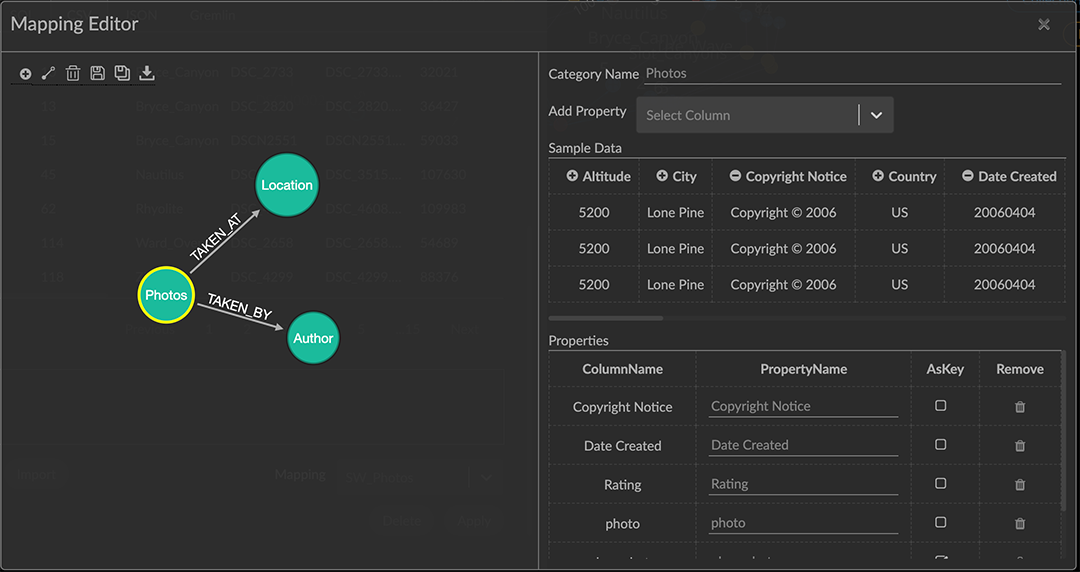
Query a CSV file or RDBMS table, and construct graph patterns from the tabular data using GraphXR’s Mapping Editor.