
Using Tables
The Table panel displays nodes and edges and their properties as rows and columns. When you open the Table panel, basic tables are provided. Using these tables, you can:
Skim data by category or relationship, and review its properties.
Search data by category or relationship and select the returned nodes or edges.
Click a table row to fly to that node or edge.
Export a table as a CSV or Excel file.
To edit the values, change the name of a category or relationship, add or remove rows, or reformat a table you must use the Enhanced Table option.
Using Basic Tables
In the Table panel, separate Category and Relationship tabs let you display tables of the nodes or edges for the categories or relationships in any selection of data. When nothing is selected in the graph space, the tables include all the data.
To use basic tables:
Either select data of interest, or deselect all data to include all the data in the graph space.
Open the Table panel, and choose either the Category or Relationship tab.
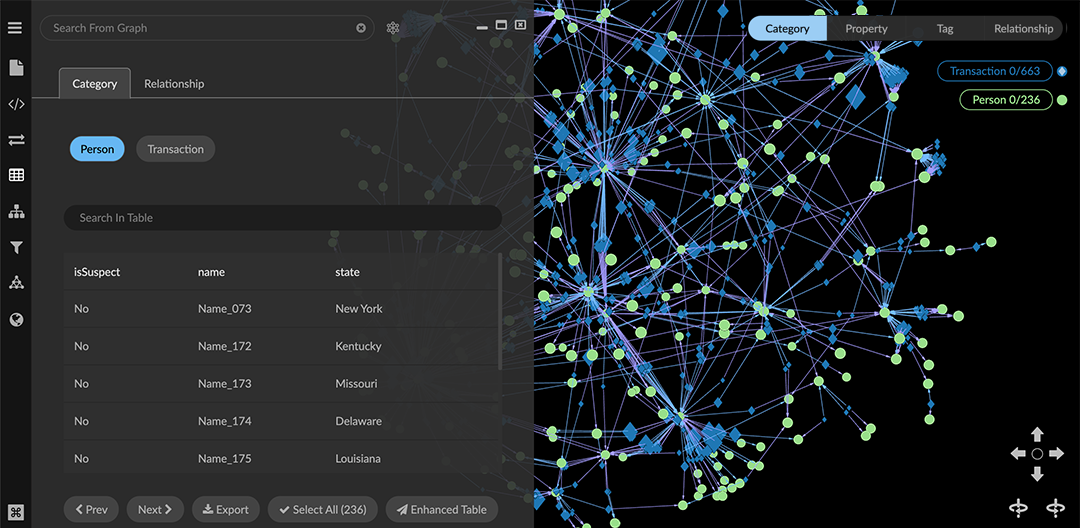
Click a category (or relationship) name to display the table of its nodes (or edges) in the graph. You can:
• Scroll through the table using scroll bars and Next or Previous page controls.
• Enter a search term to find only nodes (or edges) with matching properties.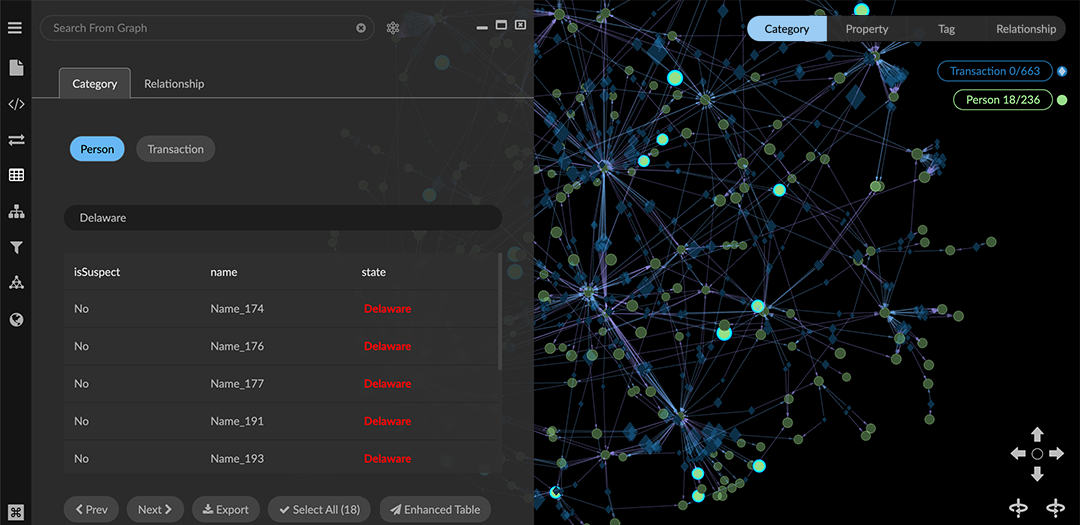
• Click Select All to select the data returned by a search.
• Click a single table entry to center the view on that node or edge.
• Click Export CSV to export the entire table as a CSV file.
• Click Export Excel to export the entire table as an Excel file.
Using an Enhanced Table
The Enhanced Table option adds editing and selection capabilities to the basic tables. It displays all the data currently visible in the graph space (i.e., data that are not hidden), whether currently selected or not.
You can:
Re-name any category or relationship.
Search, select, and edit individual rows (nodes or edges) and columns (properties)
Export data as a CSV or Excel file, mark it in the graph, or remove it.
To use an Enhanced Table:
Double click in an empty area of the graph to deselect all data, and open the Table panel.
NOTE: Even if you’ve selected data, an enhanced table will still display all the data.Click the Enhanced Table button on the bottom right of the Table panel.
The enhanced table is initially tethered to the graph space, but you can click the airplane icon at the upper right corner to display it in a separate browser window.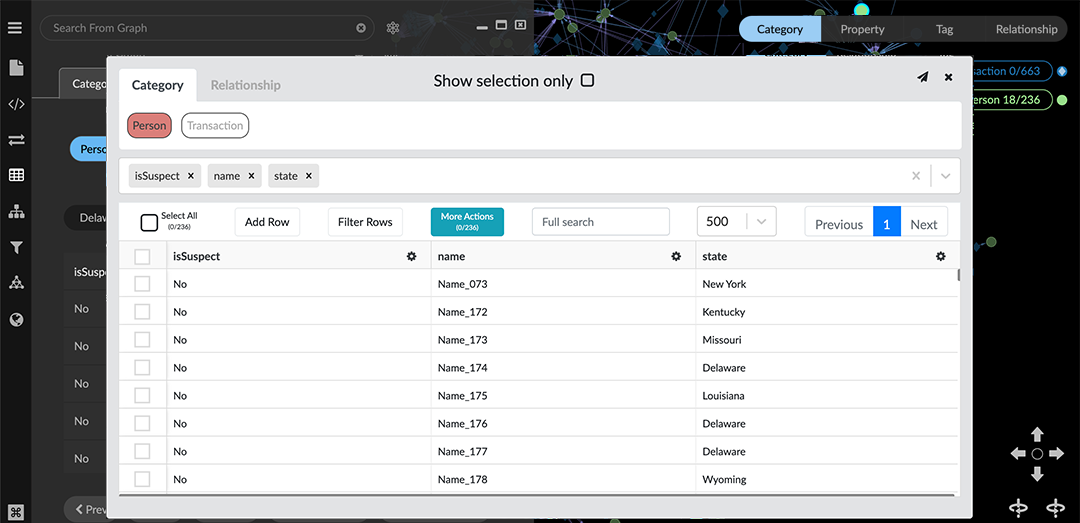
In the enhanced table you can:
Show the data for any Category or Relationship by clicking the appropriate tab and label.
Change the name (label) of an existing Category or Relationship. Simply double-click a label (e.g. Person), enter a new name in the text box and hit return.
Show only nodes that are currently selected in the graph space, by clicking the Show selection only checkbox.
Add or remove properties from the table headings using the dropdown menu and property labels.
Sort the table by clicking a property name in the table heading.
Edit the property data in a table by clicking on it.
Add a row to the table.
Select table entries using the checkbox in the first table column.
Filter Rows, either by selecting rows using the checkbox, or by entering a keyword search in the search field, and selecting the resulting rows. The number of selected rows is displayed on the More Actions menu, and underneath the Select All checkbox.
From the More Actions menu you can:
Export Selected as CSV. A CSV file containing the number of selected rows will be exported. You can export just the rows you've filtered or selected, or click the Select All checkbox to export the entire table.
Export Selected as Excel. An Excel file containing the number of selected rows will be exported. You can export just the rows you've filtered or selected, or click the Select All checkbox to export the entire table.
Mark Selected in Graph. Selects data in the graph space that you've selected in the table. You can then go to the graph space to work with the selection, for example to add a tag.
Delete Selected from Graph, which deletes marked nodes from the graph space.
WARNING: Before deleting selected data, take a Snapshot. Then if you delete data by mistake, you can revert the action by loading your most recent snapshot.