
Using Parametric Layouts
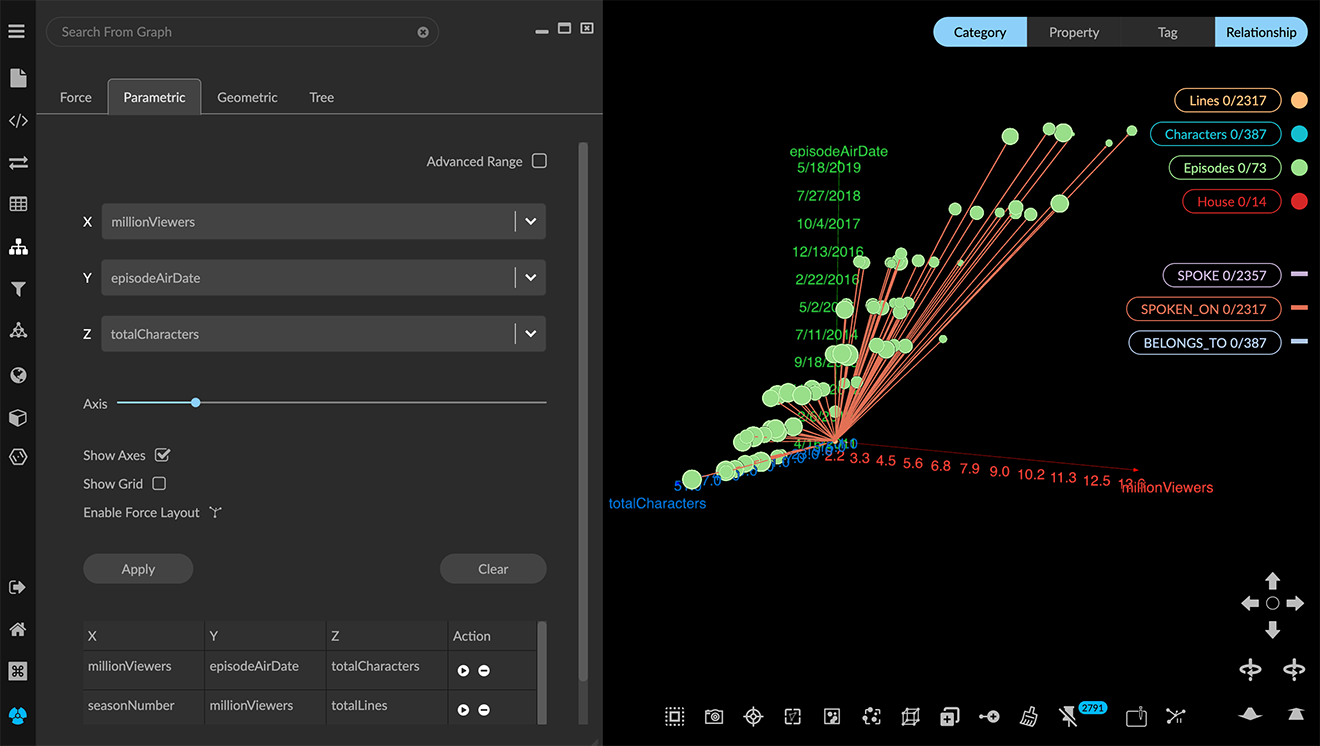
A Parametric layout lets you display scatter plots of numerical property values on X-, Y-, or Z- axes. You select the numerical properties to be displayed each axis, then Apply the layout.
A list of parametric layouts you have applied is saved in the lower part of the panel. The property displayed on each axis is listed, and icons in the Action column let you Run or Delete a saved layout.
In addition, you can:
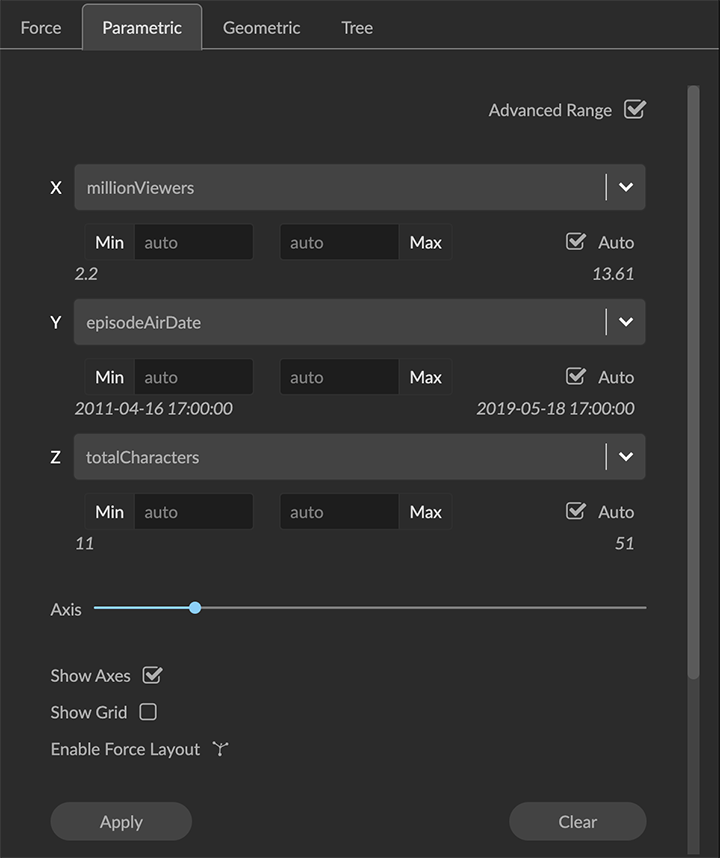
Click the Advanced Range checkbox to set minimum and maximum values for each axis.
Adjust the scale of the axes using the Axis slider.
Choose to show or hide the Axes and/or the Grid.
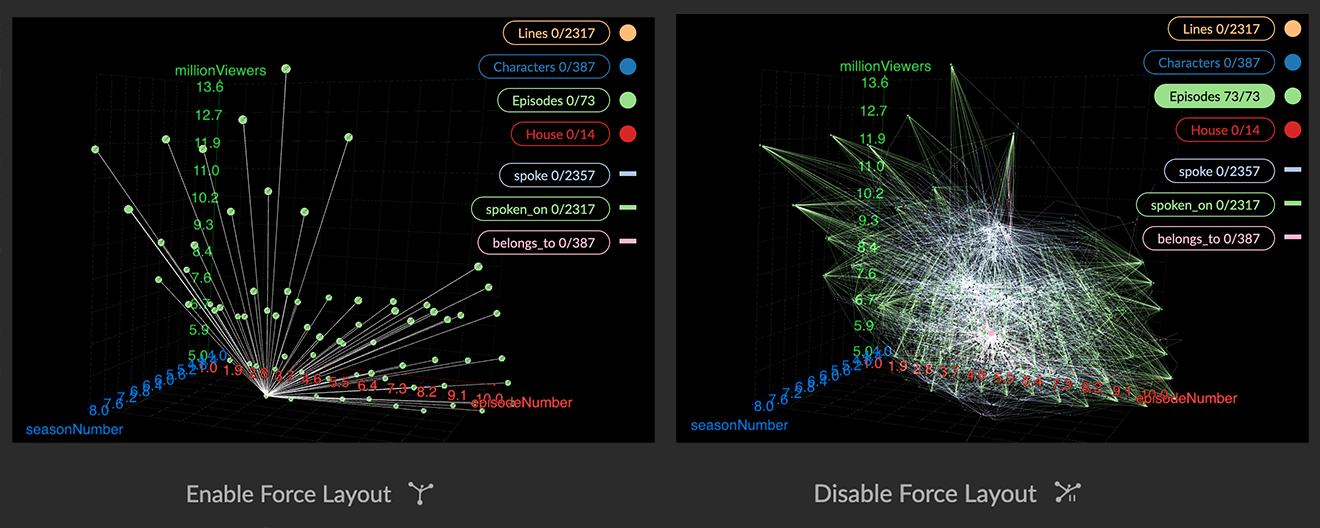
Click the Enable Force Layout toggle to additionally display the connected nodes that don’t have the selected properties in a force-directed layout. The toggle label changes to Disable Force Layout. Click again to return to the scatter plot of just the specified nodes. The default is to collapse these nodes at the origin, because displaying them usually obscures the scatter plot of interest.
To create a parametric layout:
Open the Layout panel and choose the Parametric tab.
Choose a property for the X-, Y-, and Z-axes from the drop down menus.
NOTE: You can flatten the layout to a 2D projection by choosing none as the Z-axis.Optionally, click the Advanced Range checkbox to set a range of property values to display.
Use the Axis slider to adjust the size of the scatterplot space.
Click the Show Axes checkbox to show labeled X-, Y-, and Z- axes. Click the Show Grid checkbox to add gridlines.
Click Apply to apply the currently specified parametric layout and add it to the list of saved layouts.
Parametric layouts are deleted once you log out of the project. However, saved layouts do persist in a Snapshot archive or data View.