
Using Grove
Grove + GraphXR is designed to support development of customer-facing dashboards, as well as collaborative (code-sharing) notebooks for data discovery and analytics. It is an authoring and publishing environment that runs in the browser with GraphXR.
For developers, Grove leverages functional JavaScript and open-source visualization packages such as D3, Vega-Lite, Plotly, and Observable Plot to delve deeper into high-dimensional data. A full-featured Grove API is available to provide access to GraphXR functions needed to reproducibly load, transform, and display graph data.
To jump-start exploration and development, the Grove Demo project includes example notebooks that general users can access and that developers can use to learn from, copy, and craft their own notebooks. Examples demonstrate Grove basics such as:
Connecting graph data + local CSV/JSON files to your Grove notebook.
Using the Grove API to filter large datasets
Using open-source infographic libraries
Building Interactive search tables
Tutorials available in the Grove demo project use sample sets of publicly available data. You can copy code you see in this tutorial into your own Grove notebook to practice. Reach out to info@kineviz.com if you have any questions.
Grove Demo Quick Tour
Grove is available in any GraphXR project. However, the Grove Demo project includes example notebooks we can use for a quick tour of key Grove functions and capabilities.
Opening a Grove notebook
To open a Grove demo notebook:
Log in to GraphXR and open the Grove Demo project.
Go to the Projects panel and Extensions tab, and select Grove from the dropdown menu.
Click the Panels icon (ctrl+Alt+P) at the upper right to see demo Notebooks.
Click the Overview or Share tabs to see notebooks available in the demo, either in tile or list view.
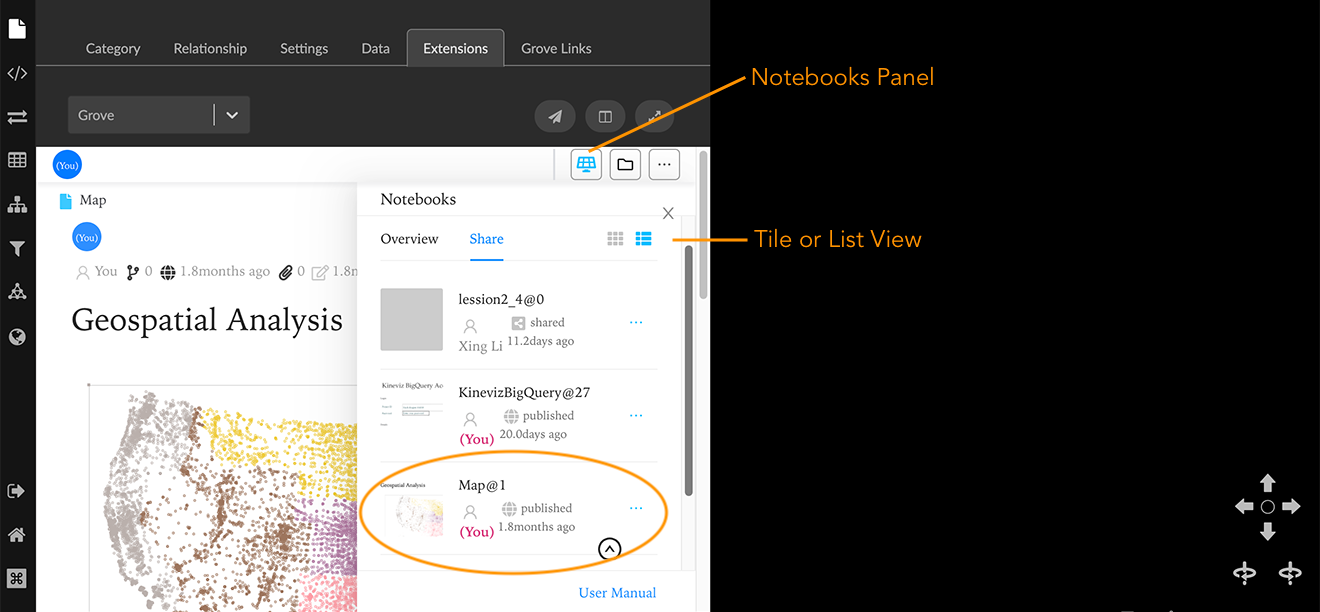
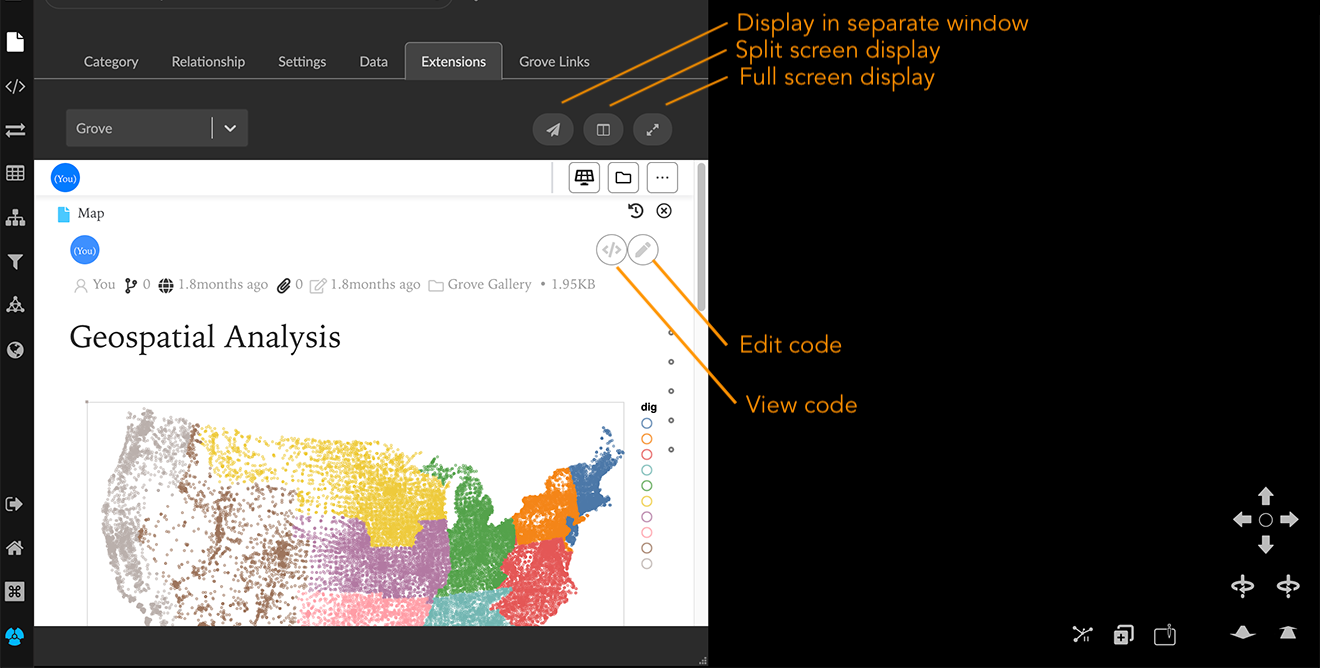
Click to select a demo notebook. (e.g. Map, entitled Geospatial Analysis), and dismiss the Notebooks panel. The selected notebook displays in the split screen. To use more of the screen you can click the Full Screen icon at the upper right to use the entire screen, or the Airplane icon to display the notebook in a separate window.
Navigating the notebook
A Grove notebook consists of cells of Observable-inflected javascript code. The code does not have to execute in the order it appears. Instead, cells that display results or require user interaction can be placed at the top, and other processing code can be organized in cells below, often in an Appendix.
The simple Map notebook above loads geospatial data for counties, and displays the data on a map, colored by region. A Load Counties button appears below the map.
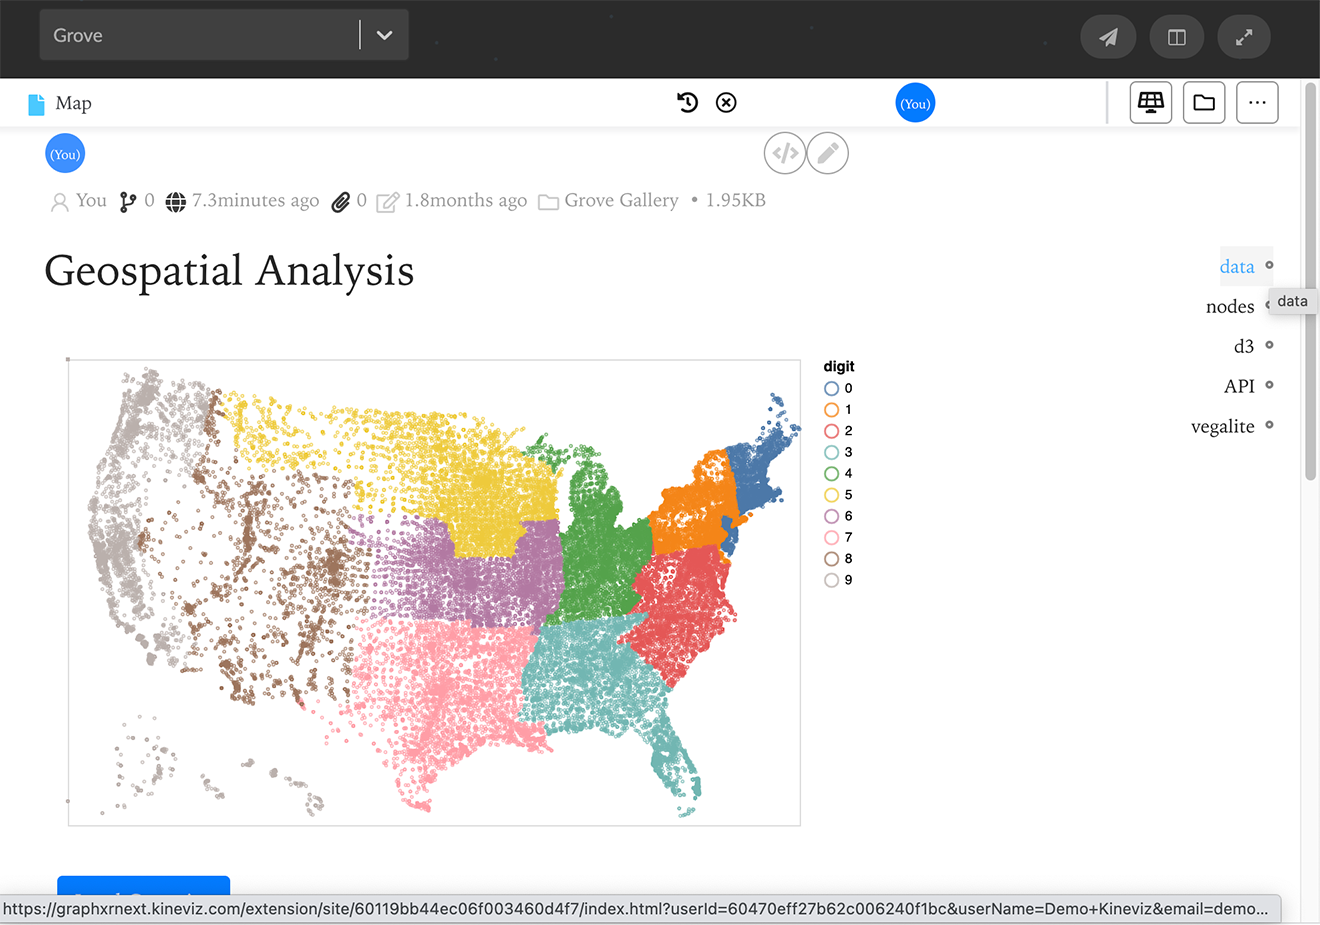
Roll over the small circles at the far right margin to see names of the cells in the notebook. Clicking a circle takes you to the code cell. In this notebook, a GraphXR API call is used, and Vegalite and D3 javascript packages provide data parsing and geospatial mapping.
Title bars located at the top of the window provide information about the project and the open notebook, ways to navigate Grove functions and to edit the code. NOTE: The top bar is divided into two, depending on the size of your browser window.
Title bar functions
Depending on the width of your browser you see one or two title bars at the top that display:
The notebook name.
Browser history icon. Click to display a list of the notebooks you’ve opened recently.
A close icon to close and exit the notebook.
Notebooks Panel icon, to display notebooks available to the project.
Folder icon, to navigate to the Grove project folder.
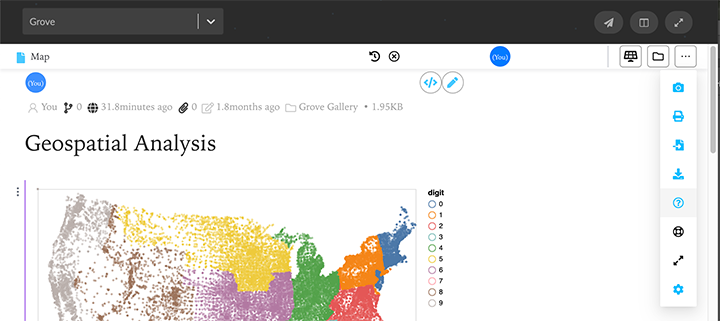
More icon (three dots), for a dropdown menu of additional functions:
Screen Shot, to take a screen shot of onscreen display.
Print, to print the displayed results.
Import Files, to browse and select data to be imported.
Export All, to export the entire notebook and its data in a .zip file.
Help, for a useful list of keyboard shortcuts for many notebook actions, organized under File actions, Editing Code, and Cell Shortcuts headings.
Safe mode, a code-only view that lets you work with issues that could crash or hang the normal editor.
Full screen, to toggle between full screen and split screen mode.
Settings, to set various project-wide settings such as auto-save frequency, default star and access permissions, and the code theme used.
Badges for the contributors to the notebook.
View code and Edit code icons. This displays the javascript code cells and makes them editable.
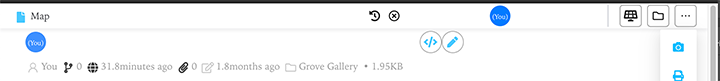
An additional title bar includes information and action icons for the notebook, including:
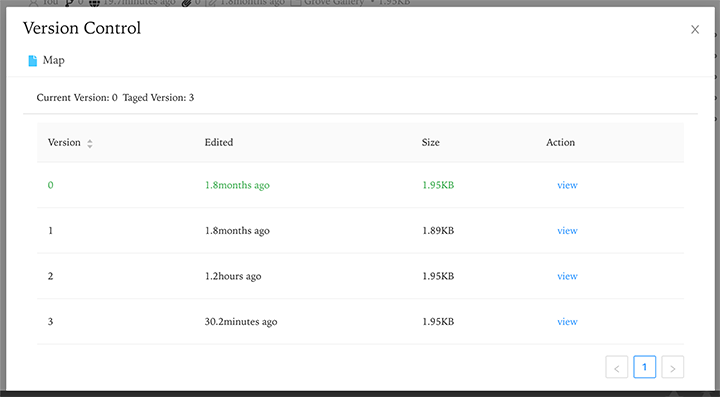
Version icon. Click to display a Version Control history for this notebook.
Publish (globe) icon. Click to display a Publish Settings dialog where you can change the permission level for the notebook or unpublish it.
The latest published time
File attachments, and connected databases(available only in private notebooks).
The last publication time, folder location, and size of the notebook.
Accessing shared notebooks
Once you share a notebook, it appears under the Share tab in the Notebooks panel.
You can also access a shared notebook under the Grove Links tab. This may be a more immediate way to explore a shared notebook.
To open a Grove Link notebook:
Go to the GraphXR Projects panel and Grove Links tab.
Click the airplane icon next to the Notebook name (e.g. Import NYERSDA csv).
The notebook opens in a separate window.
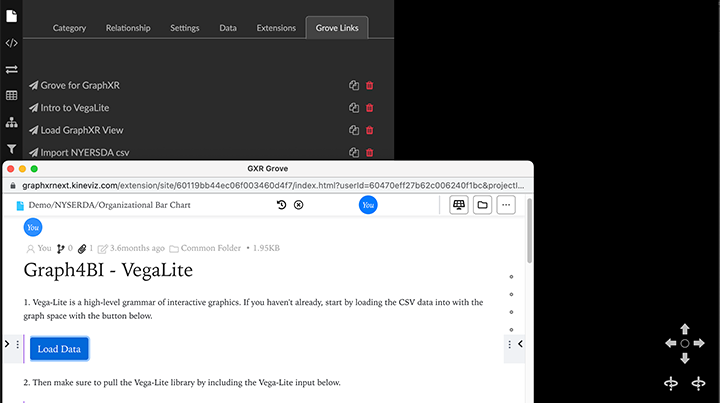
Click the Load Data button in the example notebook, which loads selected csv data to the GraphXR graph space.
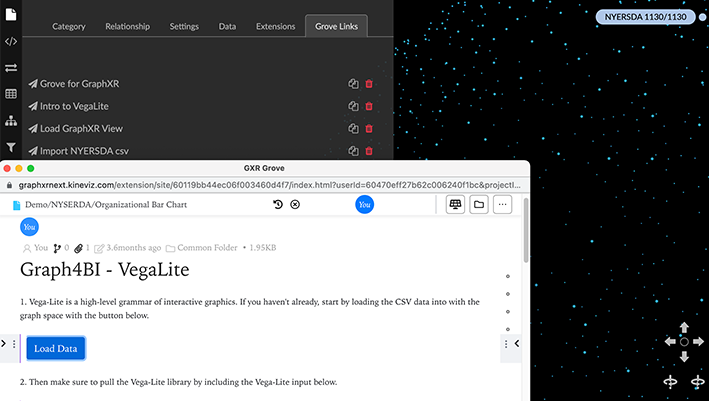
If desired, you can review the code in the example notebook, or make a copy of this notebook.